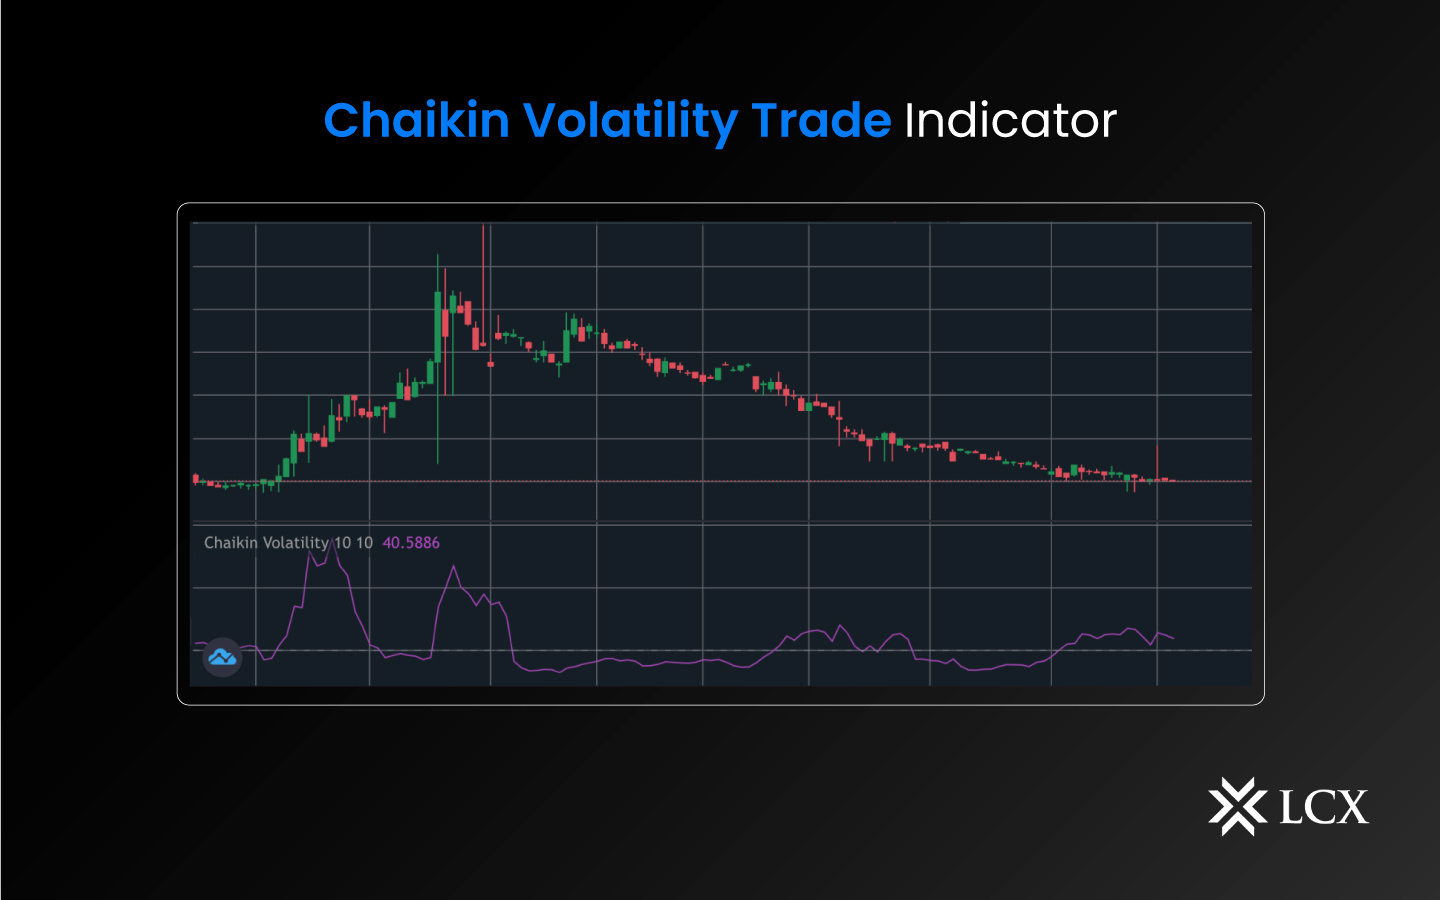
Cryptocurrencies have become one of the most prominent investment vehicles in recent years, with many traders and investors seeking to profit from the volatile nature of the market. However, the cryptocurrency market can be extremely unpredictable, making it difficult to identify the right time to enter or exit trades. To overcome this challenge, traders often rely on technical indicators to analyze market trends and make informed decisions. One such indicator is the Chaikin Volatility Trade Indicator, which is designed to help traders identify trends and anticipate changes in market volatility.
Introduction to Chaikin Volatility Trade Indicator
Chaikin Volatility is a technical analysis indicator designed to measure the volatility of an asset or security. Developed by Marc Chaikin, it is a momentum oscillator that measures the difference between the high and low prices of an asset over a specified period of time. Chaikin Volatility is widely used in the financial industry to identify trends, trading opportunities, and potential risks in the market.
How to Use the Chaikin Volatility Trade Indicator at LCX in Cryptocurrency Trading
Chaikin Volatility can be a useful tool for crypto traders since it can provide insight into possible price swings and assist in identifying trading opportunities. In the turbulent realm of cryptocurrency trading, the indicator can assist traders in determining when a more conservative strategy is warranted or when it is time to make a move.
Chaikin Volatility is calculated by taking the difference between the highest and lowest prices of an asset over a specified period and dividing that value by the average of the highest and lowest prices over the same period. This is expressed as a percentage, which indicates the level of volatility in the market.
The formula for Chaikin Volatility is as follows:
Chaikin Volatility = ((Highest Price – Lowest Price) / (Highest Price + Lowest Price)) * 100
The indicator is typically plotted on a separate chart below the price chart and can be used to identify trends in the market. When the indicator is rising, it indicates that the level of volatility is increasing, and when it is falling, it suggests that the level of volatility is decreasing. By watching for divergence between the Chaikin Volatility Indicator line and the price chart, traders can use the indicator to discover potential chances for short-term trades. When the price chart is moving in one direction but the Chaikin Volatility Indicator line is moving in the opposite direction, it may signal that the market is likely to have a trend reversal, providing traders with an opportunity to enter or exit a position.
Conclusion
In conclusion, the Chaikin Volatility Trade Indicator is a valuable tool for crypto traders looking to identify trends, trading opportunities, and potential risks in the market. By analyzing price volatility, traders can make more informed decisions about when to buy, sell, or hold an asset. However, as with any technical analysis indicator, it is important to use Chaikin Volatility in conjunction with other indicators and analysis techniques to gain a more comprehensive understanding of market conditions.


