Chaikin Oscillator Trade Indicator
de LCX Team ·
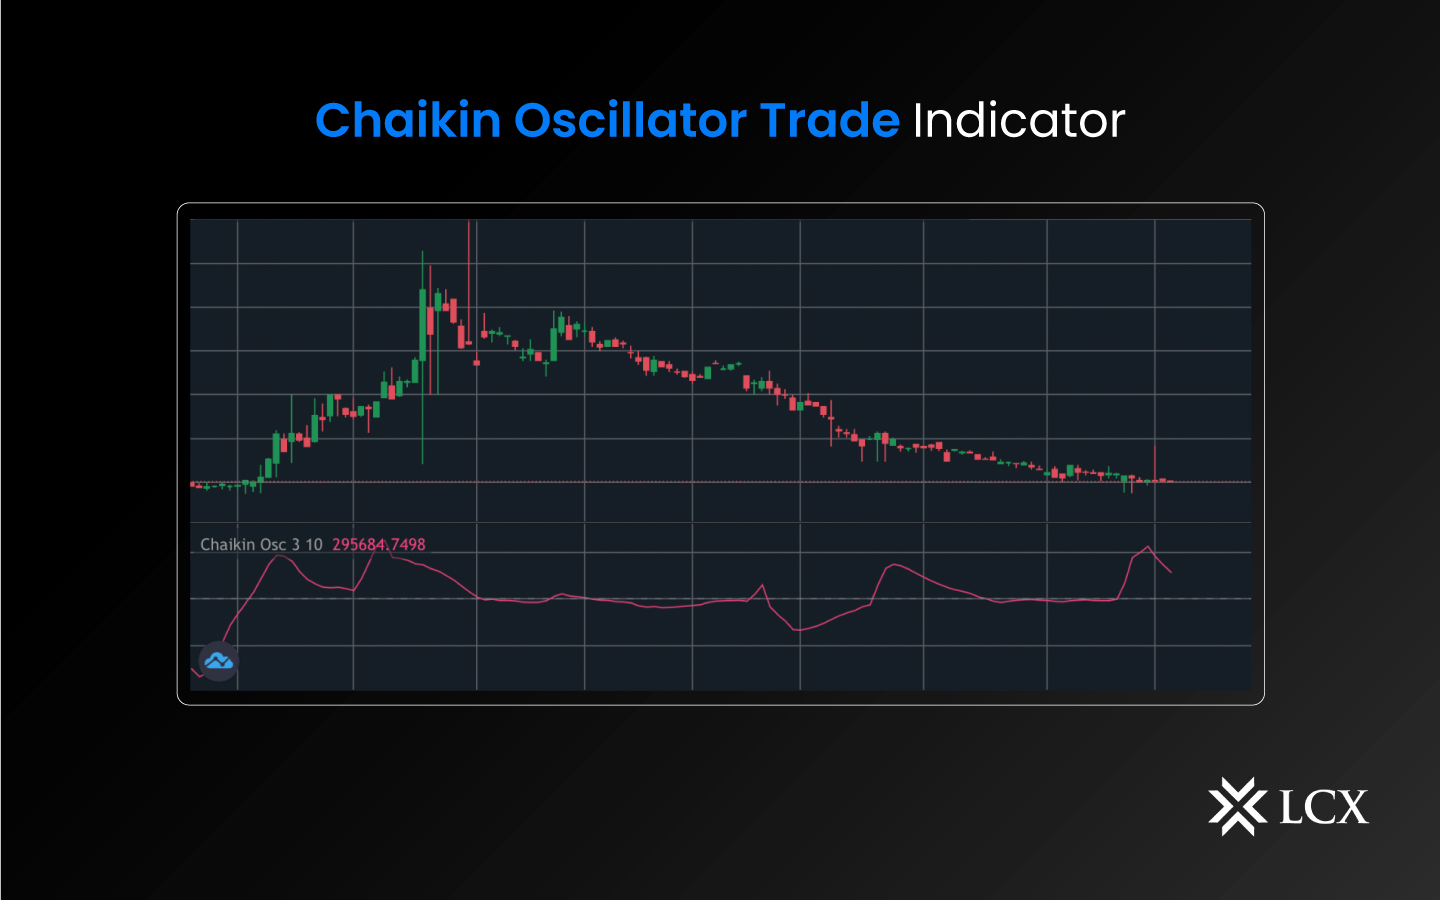
The Chaikin Oscillator is a popular technical analysis tool used by crypto traders to identify trends and momentum in the market. It measures the momentum of an asset using both price and volume data. It is a useful tool for cryptocurrency traders who want to identify trends and potential price reversals. Developed by Marc Chaikin, the oscillator is a derivative of the Accumulation/Distribution Line, which measures the accumulation and distribution of assets over a certain period.
In simple terms, it combines two moving averages of the Accumulation/Distribution line to generate a value that oscillates above and below a zero line. When the oscillator is above the zero line, it indicates bullish momentum, while a reading below the zero line suggests bearish sentiment.
Crypto traders often use this indicator to confirm trend signals or identify divergences between the price and volume of a crypto asset. For example, if the price of a cryptocurrency is rising, but the Chaikin Oscillator is showing a bearish divergence, it may indicate that the uptrend is losing momentum and a reversal is imminent.
How Is It Calculated?
The Chaikin Oscillator is calculated by taking the difference between two exponential moving averages (EMA) of an asset’s volume. The first EMA is calculated using the total volume of up days (when the price closes higher than the previous day) and the second EMA is calculated using the total volume of down days (when the price closes lower than the previous day). The difference between these two EMAs is then plotted on a graph.
The resulting graph of this indicator can be used to identify divergences between the indicator and the price of an asset. When the indicator is rising, it suggests that the buying pressure is increasing and the price may rise as well. Conversely, when the indicator is falling, it suggests that the selling pressure is increasing and the price may fall.
One common strategy for using the Chaikin Oscillator is to look for crossovers between the indicator and a moving average of the price of an asset. When the Chaikin Oscillator crosses above the moving average, it suggests that buying pressure is increasing and a bullish trend may be forming. When the Chaikin Oscillator crosses below the moving average, it suggests that selling pressure is increasing and a bearish trend may be forming.
Final Thoughts
It is important to note that the Chaikin Oscillator is not a perfect indicator and should not be relied on in isolation. Traders should use it in conjunction with other indicators and analysis techniques to make informed trading decisions. Additionally, the Chaikin Oscillator may not work as well in highly volatile markets, where volume can be unreliable.
Overall, the Chaikin Oscillator is a useful tool for cryptocurrency traders who want to measure the momentum of an asset and identify potential trends and price reversals. By using it in conjunction with other analysis techniques, traders can make informed decisions and improve their chances of success in the cryptocurrency market.