Simple Moving Average in Crypto Explained
podle LCX Team ·
Technical analysis is nothing new in the world of trading and investing. Technical analysis has one simple goal: use existing data to make more informed decisions that will likely lead to desired outcomes. Moreover, it’s easy for traders to access a wide range of technical indicators, with the moving average being the major one.
Moving indicators within technical analysis help smooth out the price action by filtering out the “noise,” which is an expression used to refer to random short-term fluctuations in price.
What are Simple Moving Averages (SMA)?
Simple Moving Averages (SMAs) are a popular technical analysis tool used by traders to smooth out price data and help identify trends. In the world of cryptocurrency trading, SMAs can be a useful indicator for identifying entry and exit points, setting stop-loss orders, and identifying the overall direction of the market.
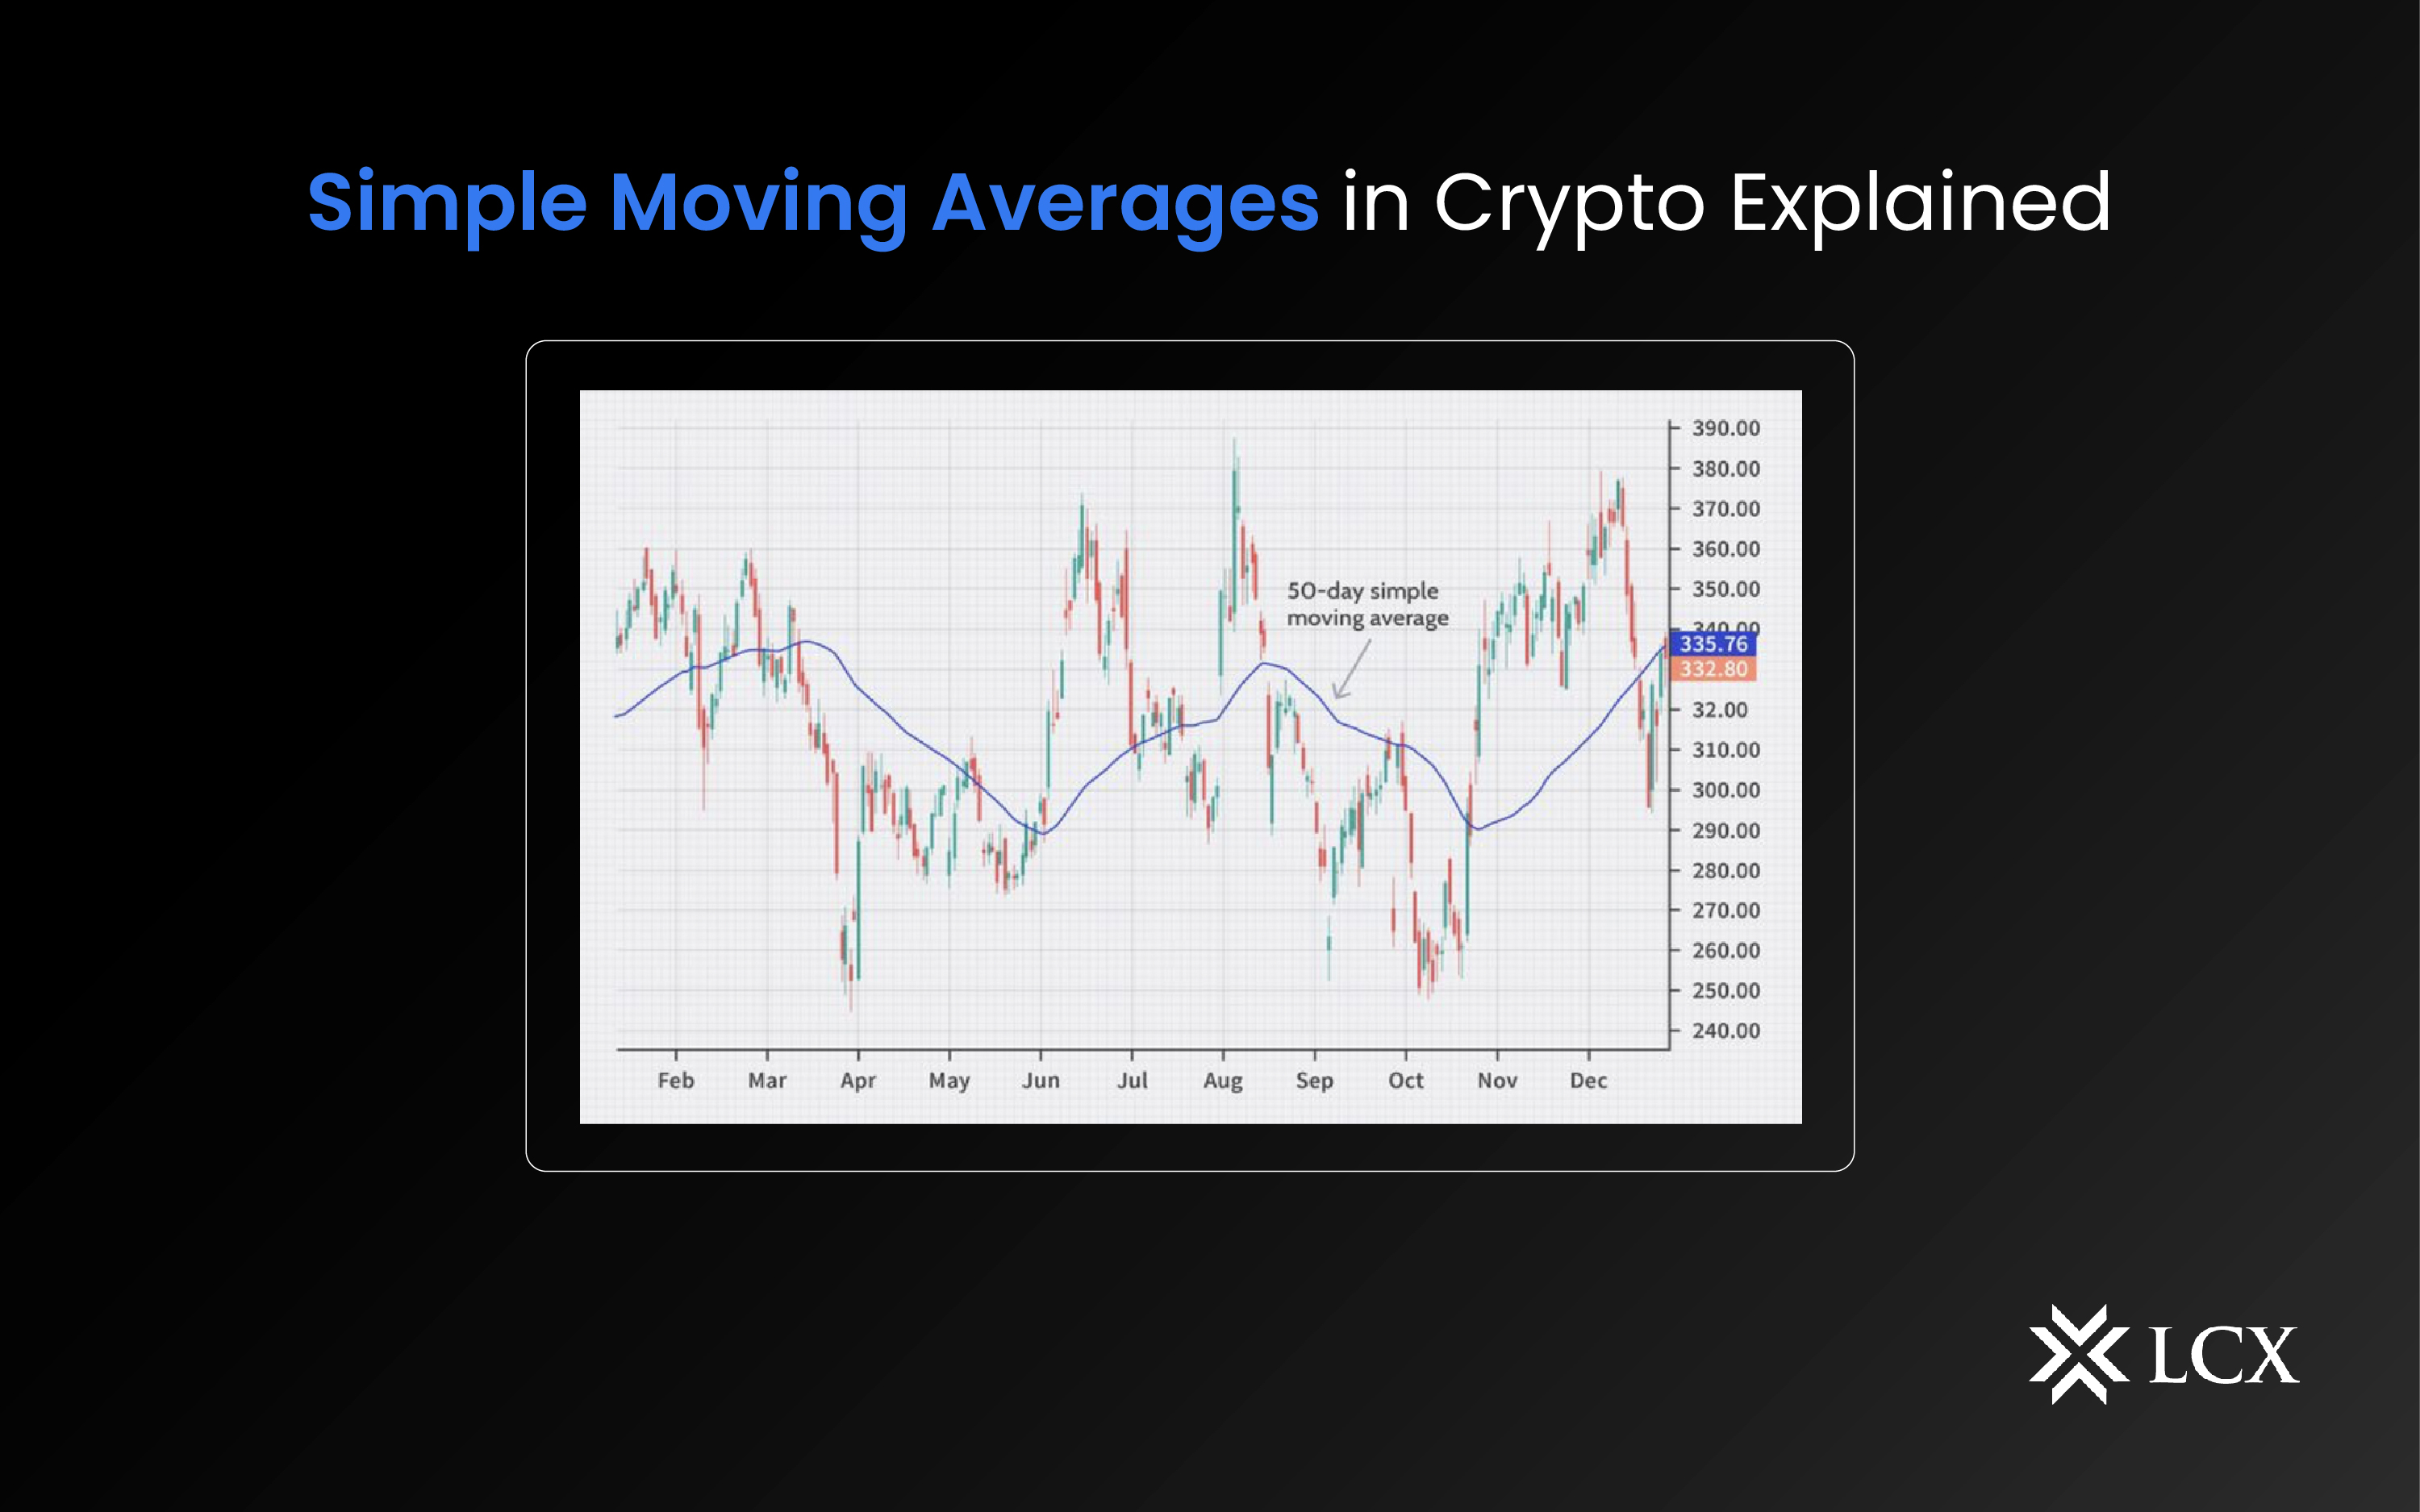
It is calculated by taking the average of a set of price data over a certain period of time. For example, if you want to calculate a 50-day SMA, add up the closing prices of the last 50 days and then divide that total by 50. The resulting average is plotted on the chart as a line, and the line is updated every day as new price data becomes available. SMAs are called “simple” because they use a straightforward calculation to smooth out the price data. Other types of moving averages, such as exponential moving averages (EMAs), use more complex measures that put more weight on the recent price data.

How is SMA calculated?
The formula for calculating a simple moving average is as follows:
SMA = (P1 + P2 + P3 + + Pn) / n
Where:
- SMA is the simple moving average formula
- P1, P2, P3,, Pn are the crypto asset’s closing prices over the specified period.
- And n is the number of periods being averaged.
Why do crypto traders use the SMA indicator?
One of the most common uses of SMAs is to help identify trends in the market. If the SMA is sloping upward, it can indicate that the market is in an uptrend. If the SMA is sloping downward, it can indicate that the market is in a downtrend. Traders can also use multiple SMAs with different time periods to get a clearer picture of the market trend. For example, if a 50-day SMA and a 200-day SMA are both sloping upward, it can be a strong indication that the market is in an uptrend. On the other hand, if the 50-day SMA is sloping upwards while the 200-day SMA is sloping downwards, it could be a sign that the market trend is starting to reverse.
Conclusion
SMA is famous for another key advantage, its simplicity, as it only requires a straightforward calculation and does not involve any complex algorithms. However, since no indicator is perfect, it is also important to note that the SMA can be prone to lag and may not always accurately reflect the current market trend. SMA is a useful tool for traders looking to identify trends and make informed trading decisions, but it should be used in conjunction with other indicators and analysis techniques to provide a more complete picture of the market.