Bitcoin’s ‘calm top’ challenges most market bottom estimates: Research

New research from Galaxy Digital suggests that Bitcoin's cycle low could form at higher price levels than previous bear markets due to the absence of speculation. The analysis places the potential bottom between $62,000 and the network's realized price at $53,600.
Galaxy head of research Alex Thorn analyzed every Bitcoin cycle top and bottom and noted that the four-year cycle continues to track closely with BTC’s historical timing. The peak-to-trough declines have steadily narrowed across market cycles, falling from 85% and 84% in earlier periods to 77% in 2022 and 51% in 2026.
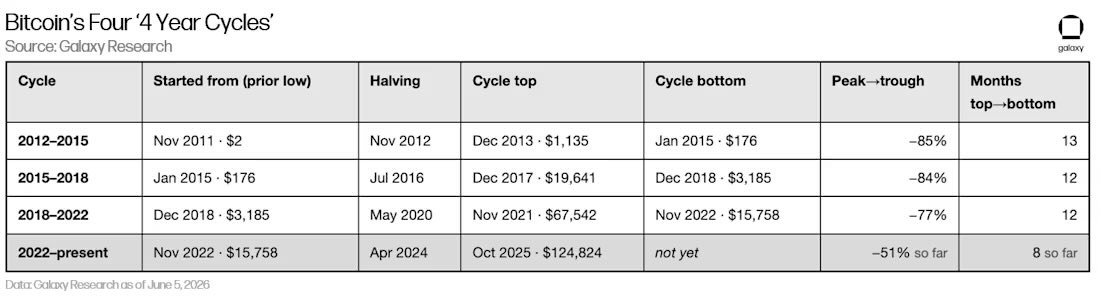
Bitcoin’s four-year cycle peak-trough analysis. Source: Galaxy Research/X
Thorn argued that Bitcoin’s October 2025 top differed from previous cycle peaks. Only two of eleven traditional topping indicators flashed, while the widely followed Pi Cycle Top indicator failed to trigger for the first time. Bitcoin’s MVRV ratio, which compares market value to realized value, peaked at 2.29, compared with 2.93 to 5.91 in prior cycles. The analyst said,
“The key insight: a calm top RAISES the floor. Because October’s top was so muted, the network’s cost basis sits at 43.7% of ATH, vs ~34%, 21%, and 17% in prior cycles.”
The report also found that several key bottoming signals are still absent. Only four of thirteen indicators have triggered so far, with most of the stronger signals yet to appear.
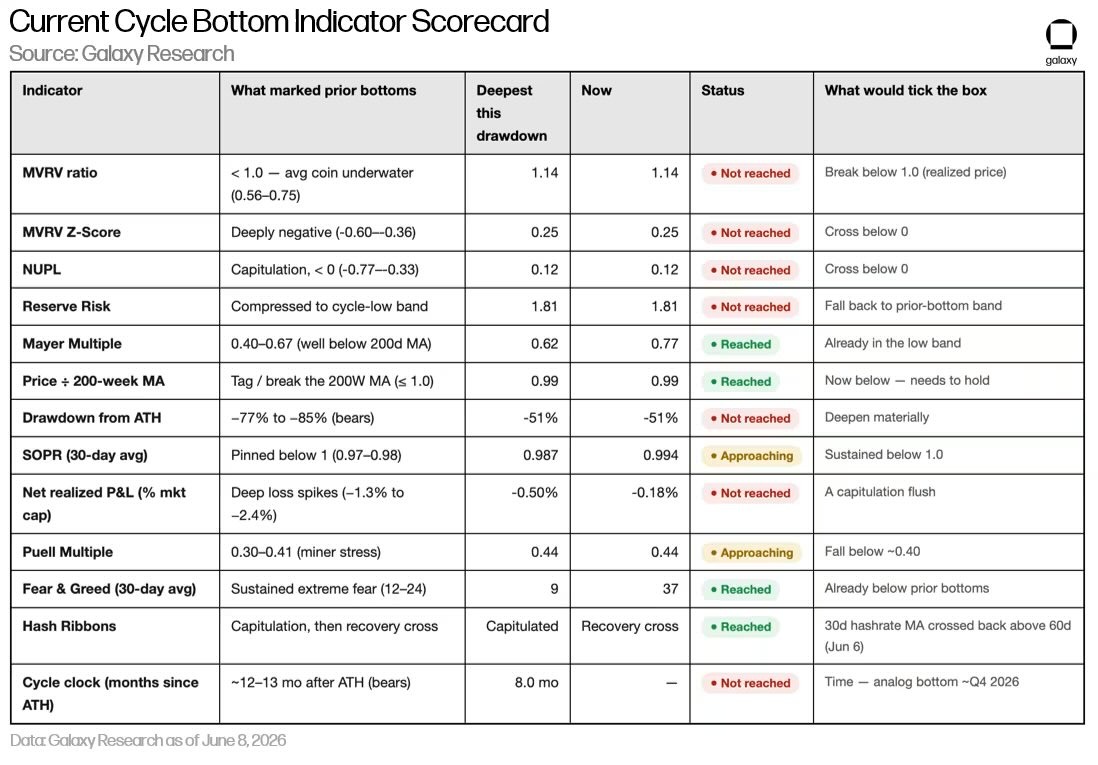
BTC cycle bottom indicator list. Source: Galaxy Research/X
Historical timing also points to the possibility of a bottom ahead. The previous cycle bottoms formed roughly 12 to 13 months after the market peak, while the current drawdown is about eight months old.
Thorn noted that, based on the current cost basis of $53,600, Galaxy estimates a base-case bottom range of $40,000 to $46,000. A deeper "washout scenario" points to $30,000-$37,000, while a shallower decline could hold near $51,000-$54,000. Despite the scenarios, Thorn also warns,
“The catch: the floor can move. cost basis is reflexive. in a real panic, coins change hands at a loss and drag the average down. A 10-30% cost basis decline pulls the implied floor from ~$40k back toward $28k.”
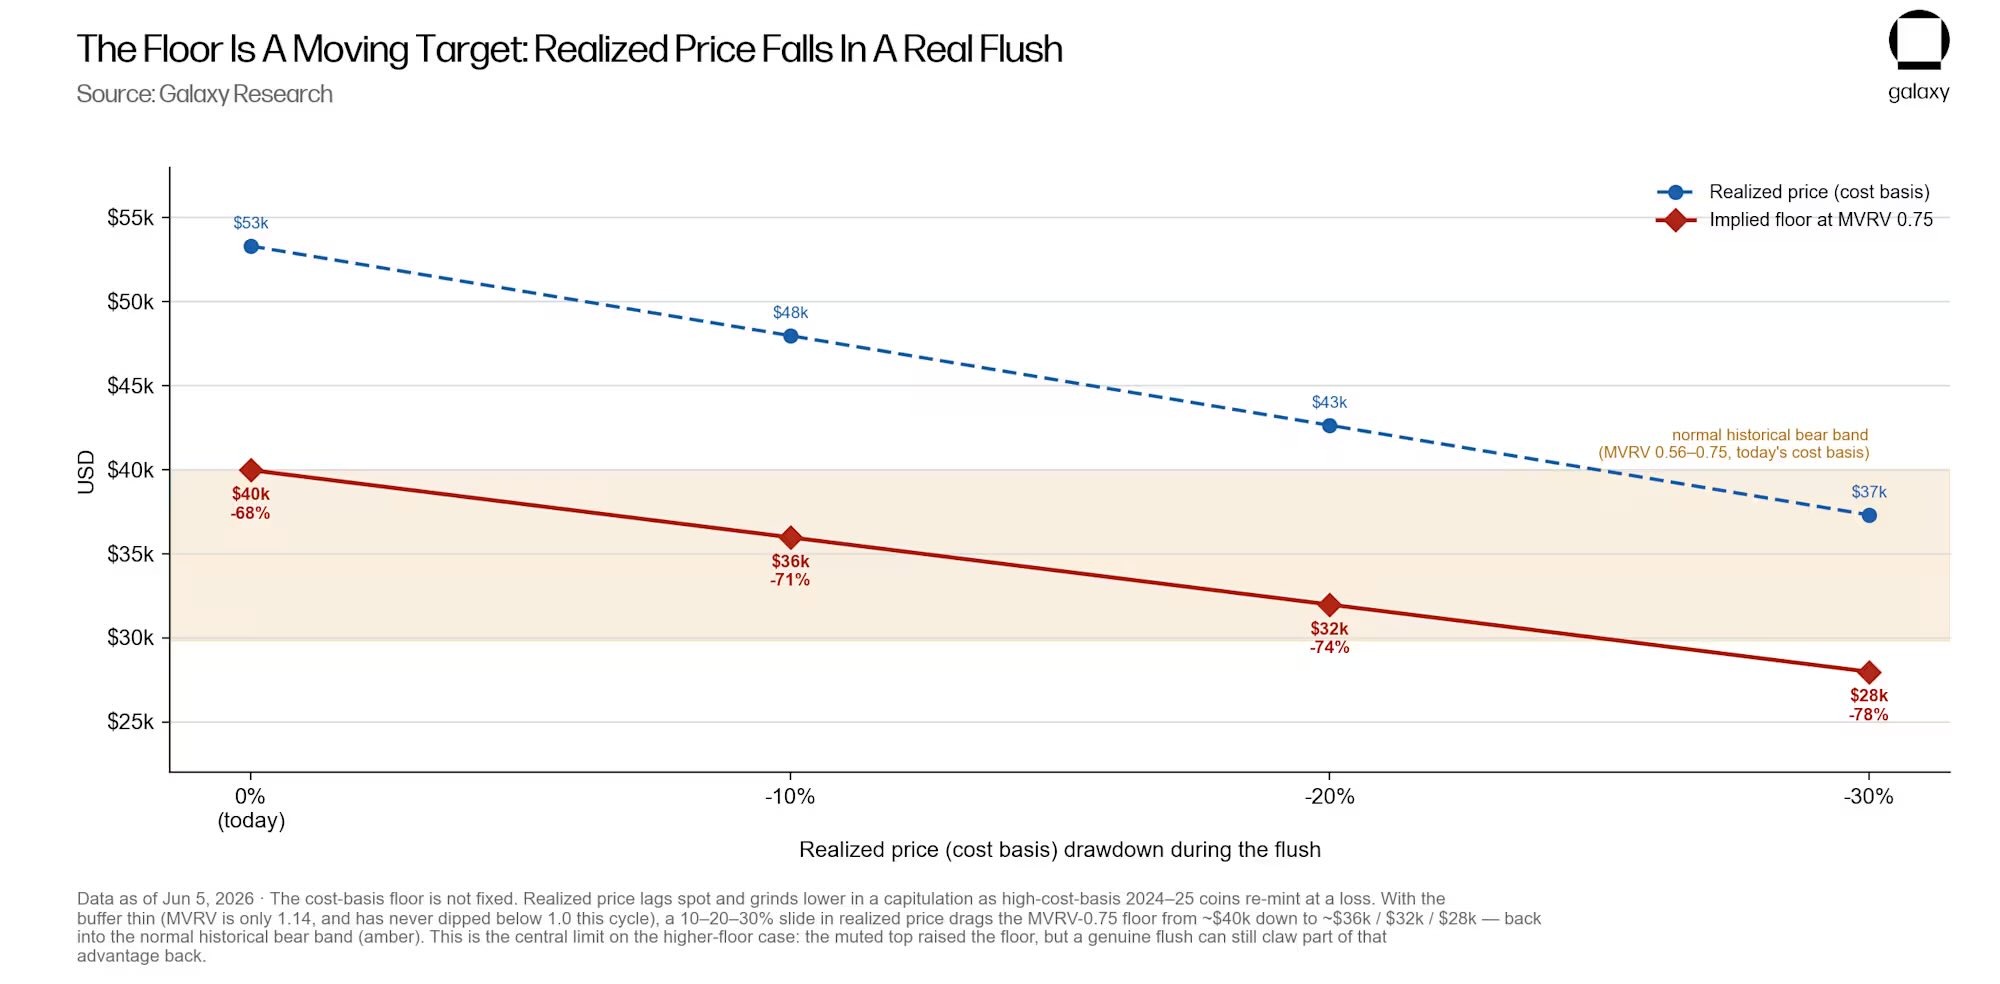
Bitcoin bottom range based on realized price analysis. Source: Galaxy Research
Related: Big Tech crash, oil volatility rattles markets: Will Bitcoin hold above $60K?
Bitcoin demand still trends lower: CryptoQuant
Onchain analysis from CryptoQuant currently places Bitcoin inside a valuation zone historically associated with major bear-market lows. BTC recently traded near $59,000, leaving it roughly 9% above its realized price of $53,600.
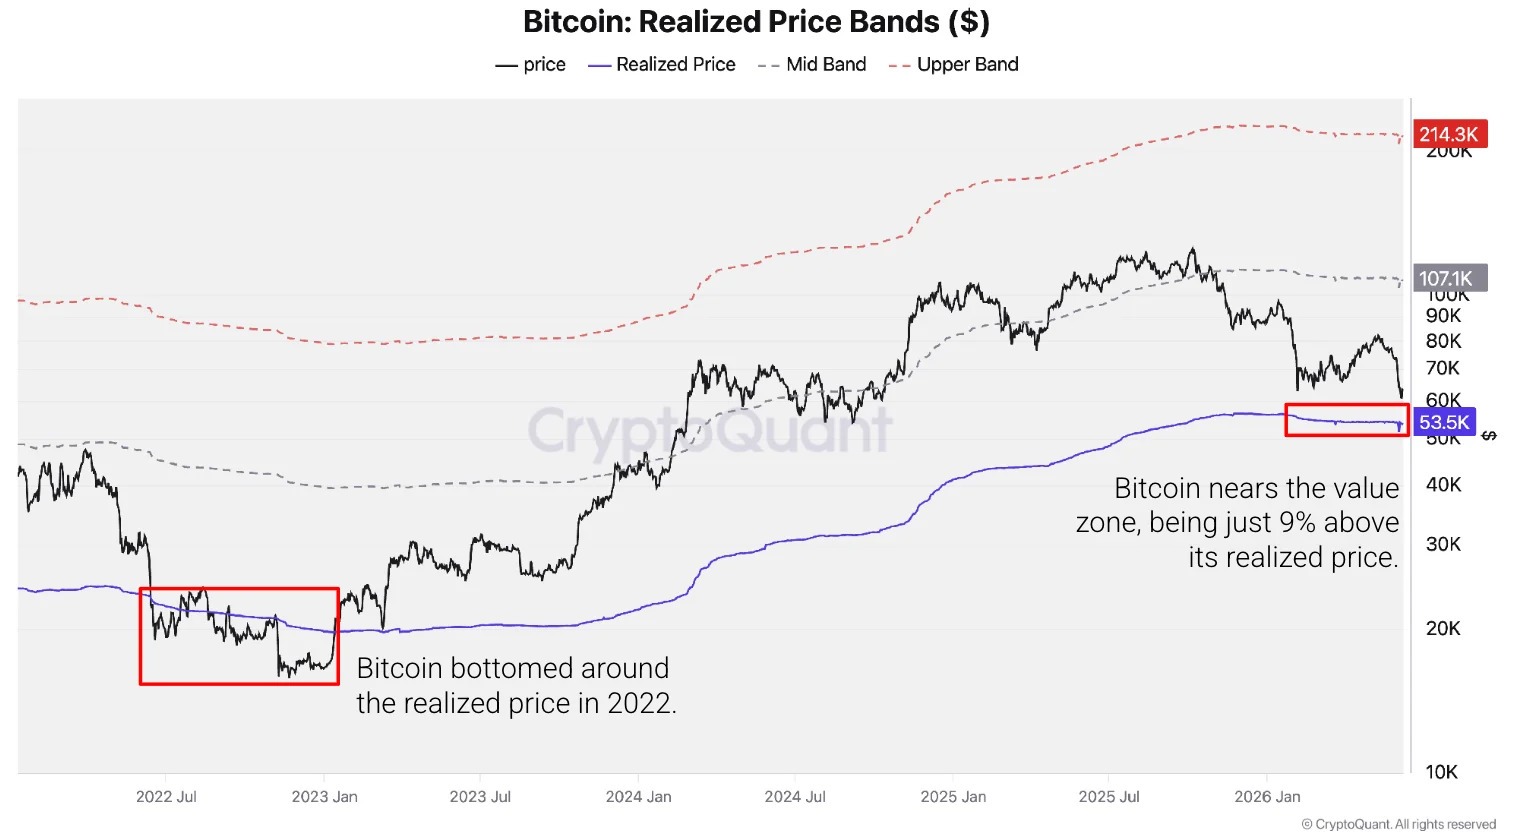
Bitcoin value zone based on realized price bands. Source: CryptoQuant
Past cycle bottoms, including the November 2022 FTX-driven sell-off, formed at or slightly below the realized price, suggesting the bottom range may again fall below the cost basis of $53,600 and overlap with Galaxy’s base projection between $46,000 and $40,000.
Demand data paints a more cautious picture. CryptoQuant reported a combined weekly decline of 652,000 BTC across speculative futures demand and apparent spot demand, marking the sharpest contraction since January 2022. The firm's one-year demand gauge has also turned negative, signaling fewer BTC buyers than a year ago.
Related: Bitcoin surfs SpaceX IPO at $64K as trader warns key BTC price support may crumble
This article is produced in accordance with Cointelegraph's Editorial Policy and is intended for informational purposes only. It does not constitute investment advice or recommendations. All investments and trades carry risk; readers are encouraged to conduct independent research.