Accumulative Swing Index Trade Indicator Guide
di LCX Team ·
The Accumulative Swing Index (ASI) is a technical analysis indicator that is used to measure the strength of a cryptocurrency trend and identify potential trend reversals. ASI measures the long-term effects of the security’s price trend based on opening, closing, high, and low prices. The ASI is a cumulative indicator, which means that it takes into account the entire price history of an asset. This makes it a powerful tool for traders looking to make informed decisions about when to enter or exit a trade.
Who invented the Accumulative Swing Index Indicator?
The Accumulative Swing Index Indicator was developed by an American mechanical engineer and real estate developer J. Welles Wilder Jr.
How is the ASI calculated?
The ASI is calculated using a combination of price and volume data. The formula for the ASI is as follows:
ASI = ASI(previous) + Swing Index x Volume
The Swing Index is a measure of the strength of a trend, and is calculated using the following formula:
Swing Index = (Close – Low) – (High – Close) / (High – Low)
The ASI is then plotted on a chart, and the line that is made shows how strong the trend is as a whole.
How does the user interpret the ASI indicator?
The ASI can be used to identify potential trend reversals as well as the strength of a current trend. When the ASI is rising, it indicates that the current trend is bullish, and when it is falling, it indicates that the current trend is bearish.
When the ASI is rising but then starts to level off or fall, it can indicate that a trend reversal may be imminent. Conversely, when the ASI is falling but then starts to level off or rise, it can indicate that a trend reversal may be imminent.
It’s also important to note that the ASI is a cumulative indicator, which means that it takes into account the entire price history of an asset. This means that it can be used to identify long-term trends as well as short-term ones.

How to use the ASI with the other indicators?
The ASI can be used in conjunction with other technical analysis indicators to provide a more complete picture of market conditions. For example, the ASI can be used in combination with the Relative Strength Index (RSI) to identify potential trend reversals.
When the RSI is above 70, it can indicate that an asset is overbought, and when it is below 30, it can indicate that an asset is oversold. When the ASI is rising and the RSI is above 70, it can indicate that a trend reversal is imminent. Similarly, when the ASI is falling and the RSI is below 30, it can indicate that a trend reversal is imminent.
How to use the ASI indicator at LCX
The LCX exchange offers integrated TradingView charts and allows traders to use indicators like accumulation/distribution and more while trading to let them tap into their full potential at trading. Users can use the LCX exchange for starters and pick among multiple trading pairs on the tab. Click on the “indicators” dropdown at the top and click on “Accumulative Swing Index” to activate the bottom of the price chart:
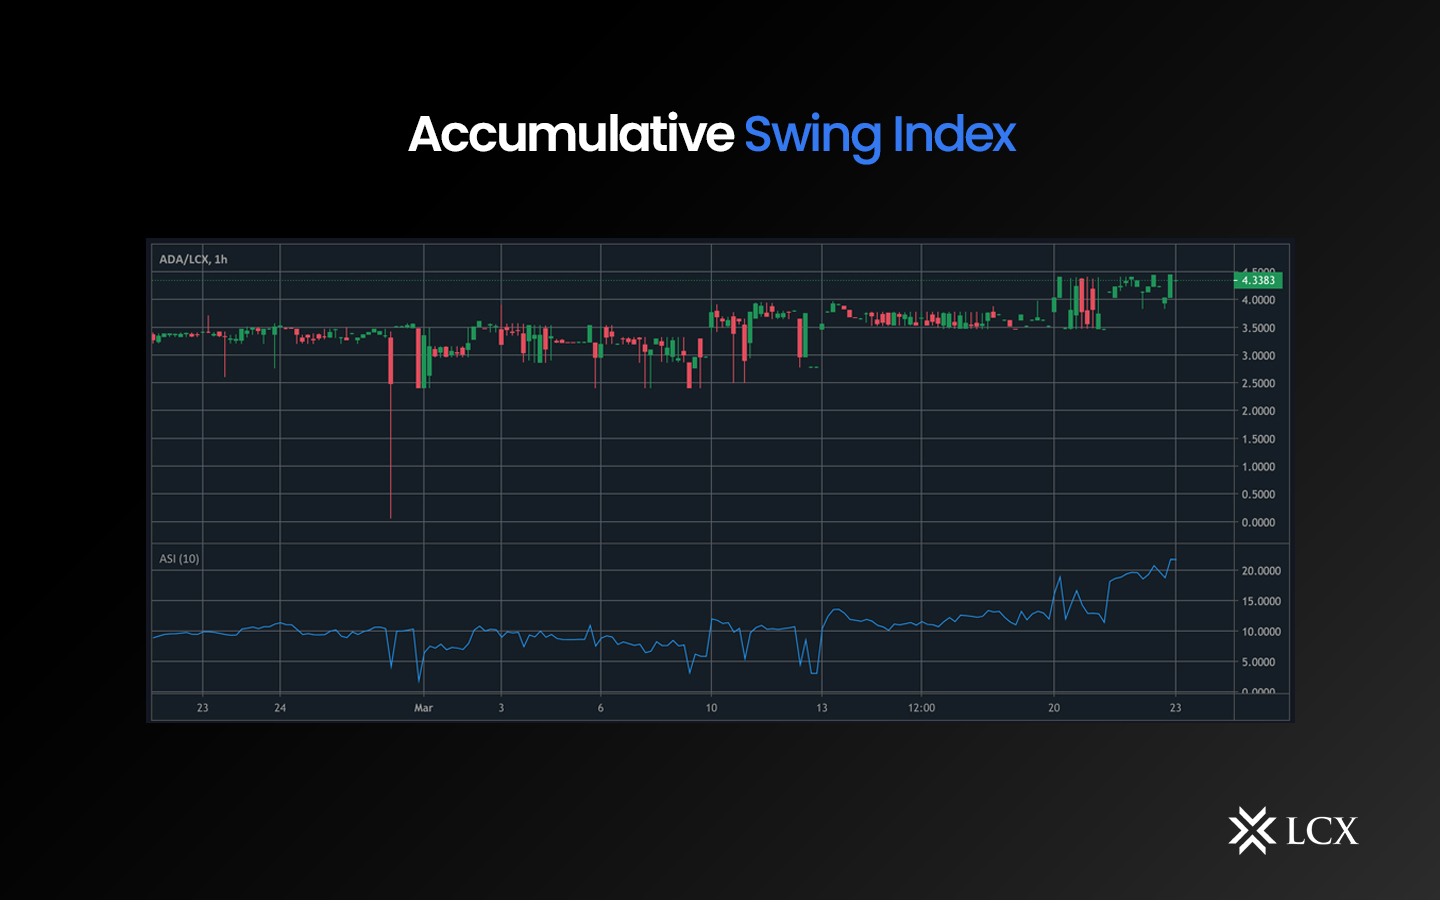
The ASI appears as a trendline:
The ASI fluctuates between positive and negative values. If the long-term is going up, the accumulative swing index will be denoted as a positive value, and vice versa- if the long-term trend is going down, the accumulative swing index will be denoted as a negative value. If the long-term trend is going sideways, that means the market is indecisive.
In Conclusion
The Accumulative Swing Index (ASI) is a powerful technical analysis indicator that can be used to measure the strength of a trend and identify potential trend reversals. It is a cumulative indicator, which means that it takes into account the entire price history of an asset, making it useful for identifying long-term trends as well as short-term trends.
The ASI can be used in conjunction with other technical analysis indicators, such as the Relative Strength Index (RSI), to provide a more complete picture of market conditions. By using the ASI in combination with other indicators, traders can make more informed decisions about when to enter or exit a trade.