Bollinger Bands Indicator in Crypto Trading Explained
di LCX Team ·
Bollinger Band is a popular technical indicator used by crypto traders to estimate volatility and find entry and exit points. Bollinger Bands have been used for decades and remain a valuable technical indicator. It consists of three lines forming a channel encompassing the price movement. Traders use Bollinger bands to gauge volatility, identify trends, and forecast reversals.
This article will describe Bollinger bands, how to calculate them, and their use in identifying opportunities for trading.
What Is a Bollinger Band?
In honor of John Bollinger, an American asset manager, and technical analyst, Bollinger bands were named after him. The Bollinger Bands were developed in the 1980s by John Bollinger for the analysis of stocks, and they have remained among the most popular tools for price analysis ever since. Despite their popularity in traditional markets, Bollinger bands are also popular in the crypto market, where traders rely on them for performance. In cryptocurrency trading, volatility indicators are extremely important.
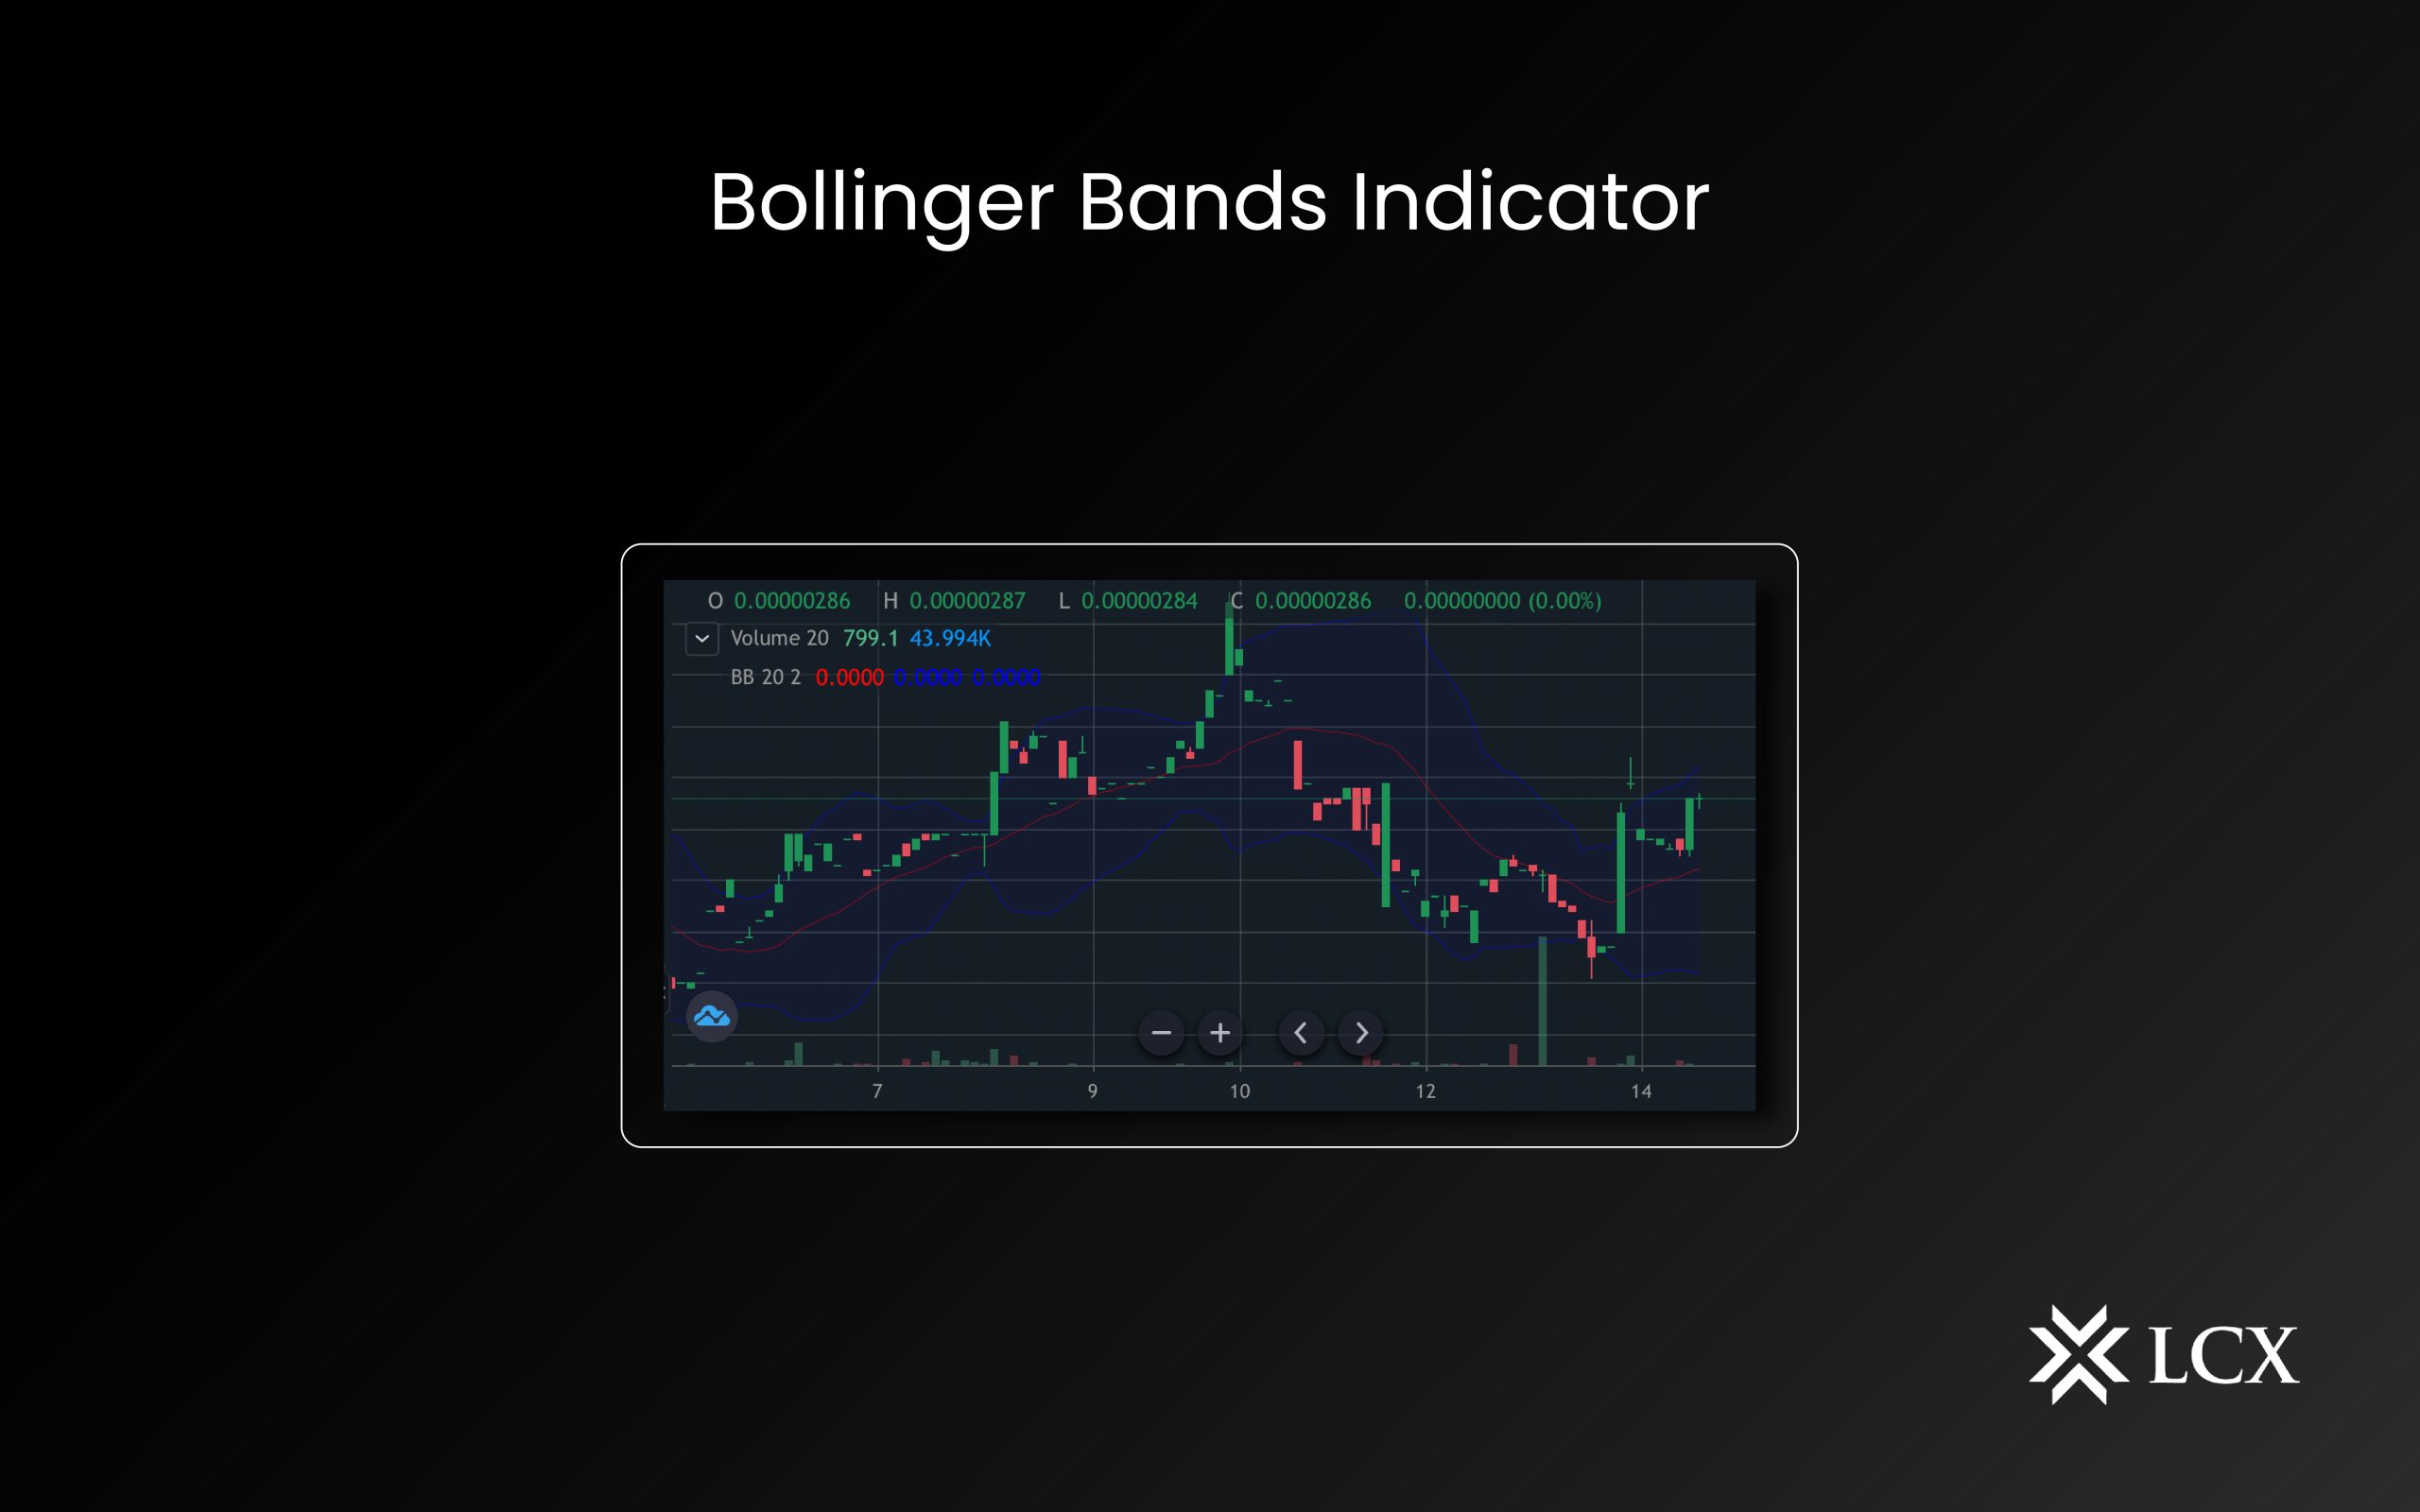
In a Bollinger Band chart, the following three lines are plotted over the asset prices:
- The middle line in the chart represents a Simple Moving Average (SMA) of N periods.
- An upper band is determined by multiplying the middle line by k times the price standard deviation (SD).
- Lower bands are calculated by subtracting the middle line from K times the standard deviation (SD).
Two lines are plotted above and below a simple moving average to form Bollinger Bands.
Simple Moving Averages (SMAs) are calculated by default with 20 days and two standard deviations for upper and lower lines respectively. Standard deviations determine the distance between lateral bands. Thus, when there is calm in the market, the bands are narrow, whereas when volatility is high, they become wider. Thus, when there is calm in the market, the bands are narrow, whereas when volatility is high, they become wider.
How to calculate Bollinger Bands?
Typically, a 20-day simple moving average (SMA) is used to calculate Bollinger Bands. A 20-day moving average would take the closing prices of the first 20 days as the first data point. Following this data point, the earliest price would be dropped, the price on day 21 would be added, and then the average would be calculated, and so on. In the next step, we will determine the cryptocurrency’s standard deviation.
How do crypto traders use the Bollinger Band?
Cryptocurrency traders can use Bollinger Bands just like they are used when trading traditional assets. Due to the extremely volatile nature of cryptocurrencies, this indicator should provide more trading opportunities and signals. LCX exchange offers integrated TradingView charts and allows traders to use indicators like Bollinger Bands while trading.
The Bollinger Bands should be set per your trading style as follows:
Short-term (Day Trading) – SMA with a period 10-day and bands at 1.5 standard deviations;
Medium-term (Swing Trading) – SMA with a period 20-day and bands at 2 standard deviations
Long-term (Position Trading) – SMA with a period of 50-day and bands at 2.5 standard deviations.
There is a good chance of a breakout either way when the bands narrow during periods of low volatility. Even so, it would be prudent to wait until the breakout is confirmed to result in a new trend. This will prevent the possibility of a spike or slump isolated to a particular time period. The Bollinger Squeeze strategy relies on this principle, and it works well with digital currencies.
Cryptocurrency traders may also use Bollinger Bands to trade W-bottoms and M-tops on candlestick charts, which are patterns that appear on a candlestick chart. In many ways, they are similar to double bottoms and double tops.
- In sideways markets, Bollinger Bands are more effective than in trending markets
- A Bollinger Band is not a perfect tool to identify extreme price readings.
- Bollinger Bands are capable of triggering signals on their own, but other technical aspects should be considered alongside these signals.
Final Thoughts
Whatever your level of crypto experience, Bollinger bands might be a useful and reliable chart analysis tool for you. The use of Bollinger Band signals alone might prove to be detrimental, just as it is with any technical indicator. Before forming a market bias, you should always consider the underlying trend and nearby support and resistance zones. The indicator helps identify the negative entries and positive entries in advance if it is used correctly. If you’re a beginner, try trading with a normal setting value and adjust according to your trading style.