
LCX Exchange
Αγορά κρυπτονομισμάτωνΑγορέςΔιαπραγμάτευση
Προϊόντα
AI Συναλλαγές
Κάντε συναλλαγές κρύπτο με AI βοηθούς
ΝΕΟ
Tokenization
Πλαίσιο περιουσιακών στοιχείων πραγματικού κόσμου
Liberty Chain
Θεσμικής ποιότητας Tokenization
Πώληση token
Ανακάλυψε νέες κυκλοφορίες tokens
Κόμβος ανταμοιβής
Κερδίστε ψηφιακά κίνητρα
Γιατί LCX;
Πληροφορίες
Η αξιόπιστη πύλη κρυπτογράφησης σας
Token LCX
Utility token για απρόσκοπτη διαπραγμάτευση
Συνεργάτες
Δίκτυο αξιόπιστων συνεργατών
Περισσότερα
ΧΑΡΑΚΤΗΡΙΣΤΙΚΑ
VIP
Premium προνόμια για κορυφαίους χρήστες
Έκθεση επιπτώσεων βιωσιμότητας
Μετρήσεις αποτυπώματος άνθρακα με κουπόνια
Συνεργάτης
Συνεργαστείτε και κερδίστε μαζί
Διαγωνισμός συναλλαγών
Διαγωνιστείτε για αποκλειστικά βραβεία
ΠΡΟΣΦΟΡΕΣ
Σύσταση
Προσκάλεσε φίλους στο LCX
Πληροφορίες token
Λεπτομέρειες, τιμή & χρησιμότητα
Campaigns
Τρέχουσες προσφορές και εκδηλώσεις
Αναλύσεις
Νέα και ανακοινώσεις
ΠΟΡΟΙ
Νέα Κρυπτονομισμάτων
Market news & analysis
Έγγραφα API
Τεκμηρίωση αναφοράς
Συχνές ερωτήσεις και υποστήριξη
Επίλυση ερωτημάτων με γρήγορο και εύκολο τρόπο
Προγράμματα εκμάθησης
Εκμάθηση βήμα προς βήμα
ΣΥΝΕΡΓΆΤΗΣ DEFI & TOKENIZATION
Toto Finance
Tokenizing Real-World Assets
MasterDEX
Αποκεντρωμένη ανταλλαγή
Σύνδεση
Εγγραφή
vip-icon
VIP Club
Σύνδεση
ΑναλύσειςLearning Center

Average Directional Index in Crypto Explained

από LCX Team · August 21, 2023

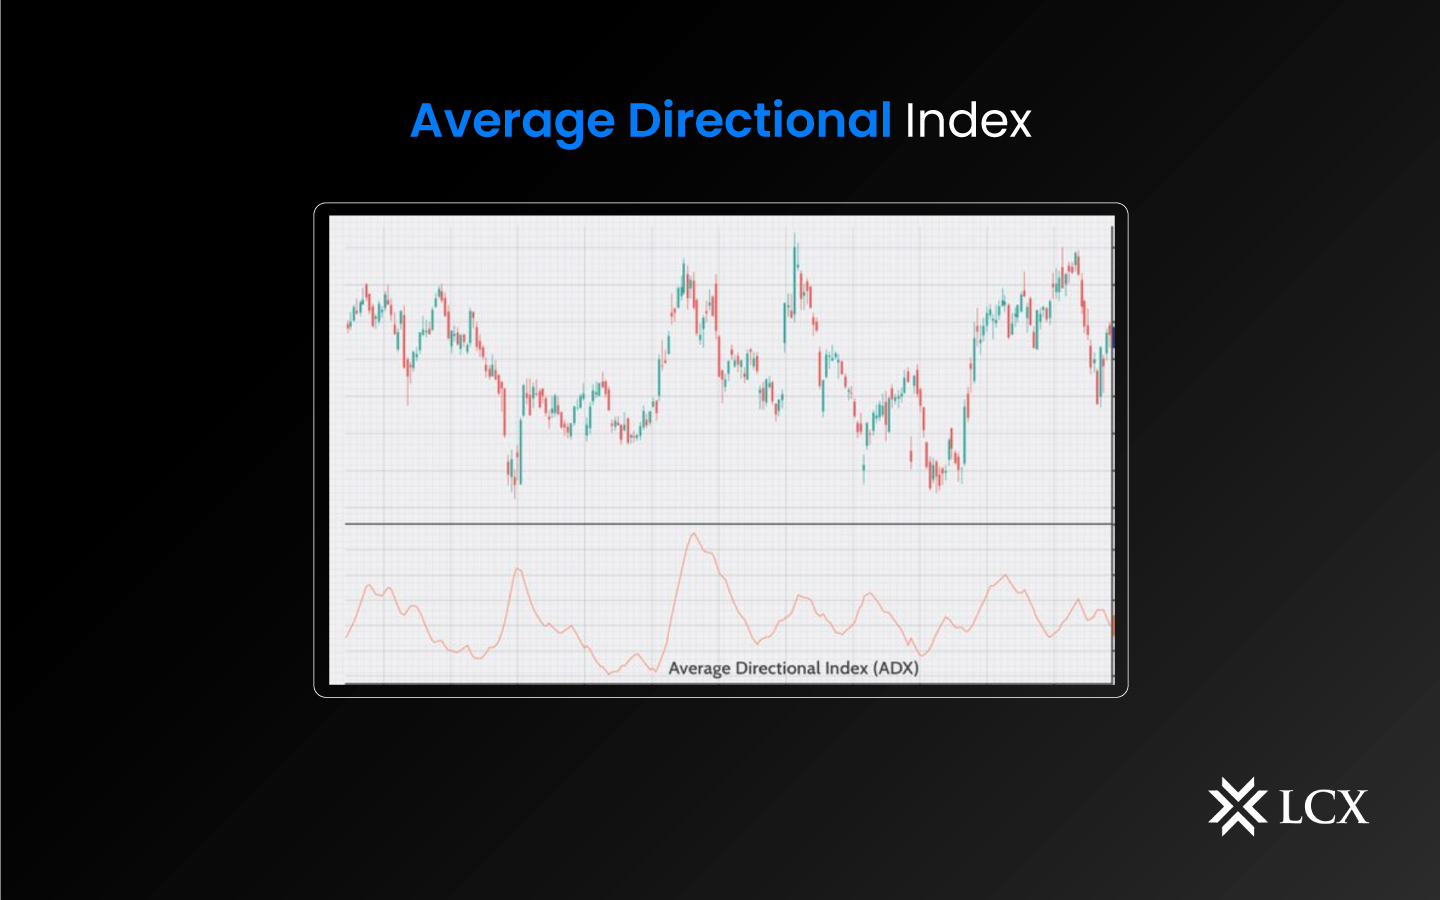
In the world of crypto trading, the Average Directional Index (ADX) is a popular technical indicator used by traders to determine the strength of a trend in the price of a cryptocurrency. Using price moving averages, ADX gauges the strength of a market trend and is represented by numbers between 1 and 100.

What is the ADX indicator? 

The ADX indicator is a technical indicator that is used to measure the strength of a trend. Its foundation is the notion that trading when the market is moving in the direction of a strong trend increases the likelihood of profit and significantly reduces the risk. The ADX indicator was developed by Welles Wilder for daily commodity charts, but technical traders and financial analysts now use it in a variety of markets to gauge the strength of trends. 

The Average Directional Movement Index (ADX) is a non-directional indicator that gauges trend strength regardless of whether prices are rising or falling.  It is based on a moving average of the difference between two other indicators: the Plus Directional Indicator (+DI) and the Minus Directional Indicator (-DI). These indicators are calculated using the high, low, and close prices of a particular cryptocurrency. The ADX is calculated using a 14- day period, and the line is plotted on a scale of 0 to 100, with higher values indicating a more robust trend and lower values indicating a weaker trend. 

The ADX indicator is typically used in combination with the +DI and -DI lines to determine the strength of a trend. When the ADX line is above 25, it is considered a strong trend. When the ADX line is below 25, it is considered a weak trend. When the +DI line is above the -DI line, it indicates that the trend is bullish. When the -DI line is above the +DI line, it suggests that the trend is bearish. If the +DI and -DI lines are close together, it indicates that the trend is indecisive.

In Conclusion 

The ADX indicator is a popular technical indicator that can be used to gauge the strength of a trend in the price of a cryptocurrency. By interpreting the ADX line in combination with the +DI and -DI lines, traders can make better trading decisions in the crypto market. It’s important to remember that the ADX indicator should be used in conjunction with other technical indicators and fundamental analysis, as no single indicator can provide a complete picture of the market.
Live

Αγοραπωλησία στο LCX

Το crypto exchange της Ευρώπης με προτεραιότητα τη συμμόρφωση, σχεδιασμένο για επαγγελματίες.

  • ✓Θεσμικού επιπέδου ασφάλεια
  • ✓Τοκενοποίηση πραγματικών περιουσιακών στοιχείων
Ξεκινήστε τις συναλλαγές
Περισσότερα από Insights
Learning Center
Decentralized Identity (SSI) 101: The End of Passwords and Centralized Logins?
July 6, 2026
Learning Center
What Is a Crypto Market Cycle? Bull and Bear Phases Explained
July 3, 2026
Learning Center
What Are Maker and Taker Fees?
June 29, 2026
Announcements
Coinbase Supports LCX Token Upgrade
June 23, 2026
Learning Center
What Is the Global Crypto Market Cap?
June 23, 2026
LCX
Ρωτήστε το AI για το LCX
ChatGPTClaudePerplexity

Περισσότερα για την LCX

  • Σχετικά με εμάς
  • Θέσεις εργασίας
  • Επικοινωνήστε μαζί μας
  • Αναλύσεις
  • Crypto Prices
  • Αλυσίδα Liberty
  • Πρόγραμμα Bug Bounty LCX

Προϊόντα

  • Token LCX
  • LCX Κερδίστε
  • Αίτηση εισαγωγής
  • Υποβολή αίτησης για πώληση Token
  • Φόρμα ανατροφοδότησης
  • Complaint Form

Νομικά

  • Χρεώσεις
  • Έγγραφα
  • Επωνυμία και εμπορικά σήματα
  • Πολιτική απορρήτου
  • Όροι χρήσης
  • Άδειες χρήσης & αποτύπωμα
  • MiCA Docs
  • Προειδοποίηση κινδύνου κρυπτοστοιχείων
  • Εμπιστοσύνη & Διαφάνεια

Οδηγοί αγοράς

  • Αγορά BTC
  • Αγορά ETH
  • Αγορά XRP
  • Αγορά SOL
  • Αγορά ADA
  • All Buying Guides >>
  • Crypto Prices >>

Υποστήριξη

  • Συνήθεις ερωτήσεις και υποστήριξη
  • Κέντρο υποστήριξης

Επικοινωνία

hello@lcx.com

LCX AG
Herrengasse 6
9490 Vaduz
Liechtenstein

Εκτελέστε συναλλαγές με την LCX

Σαρώστε για να κατεβάσετε την εφαρμογή LCX

LCX AG, Herrengasse 6, 9490 Vaduz, Liechtenstein, commercial register FL-0002.580.678-2. LCX AG has applied for authorisation as a crypto-asset service provider under MiCA (EU 2023/1114); the application is under review by the Financial Market Authority (FMA) Liechtenstein. LCX AG is not currently authorised under MiCA. LCX does not offer crypto-asset services to persons in the EEA pending authorisation; existing EEA clients are limited to withdrawals during the wind-down (see MiCA Notice). Crypto-assets involve significant risks, including total loss. LCX does not provide services to persons in the United Kingdom or the United States (Ειδοποίηση περί δικαιοδοσιών).

LCX AG © 2018 - 2026. All Rights Reserved

Telegram
X (Twitter)
Instagram
LinkedIn
YouTube
Facebook