How to Use Bollinger Bands in Crypto Trading
door LCX Team · · Updated April 14, 2024
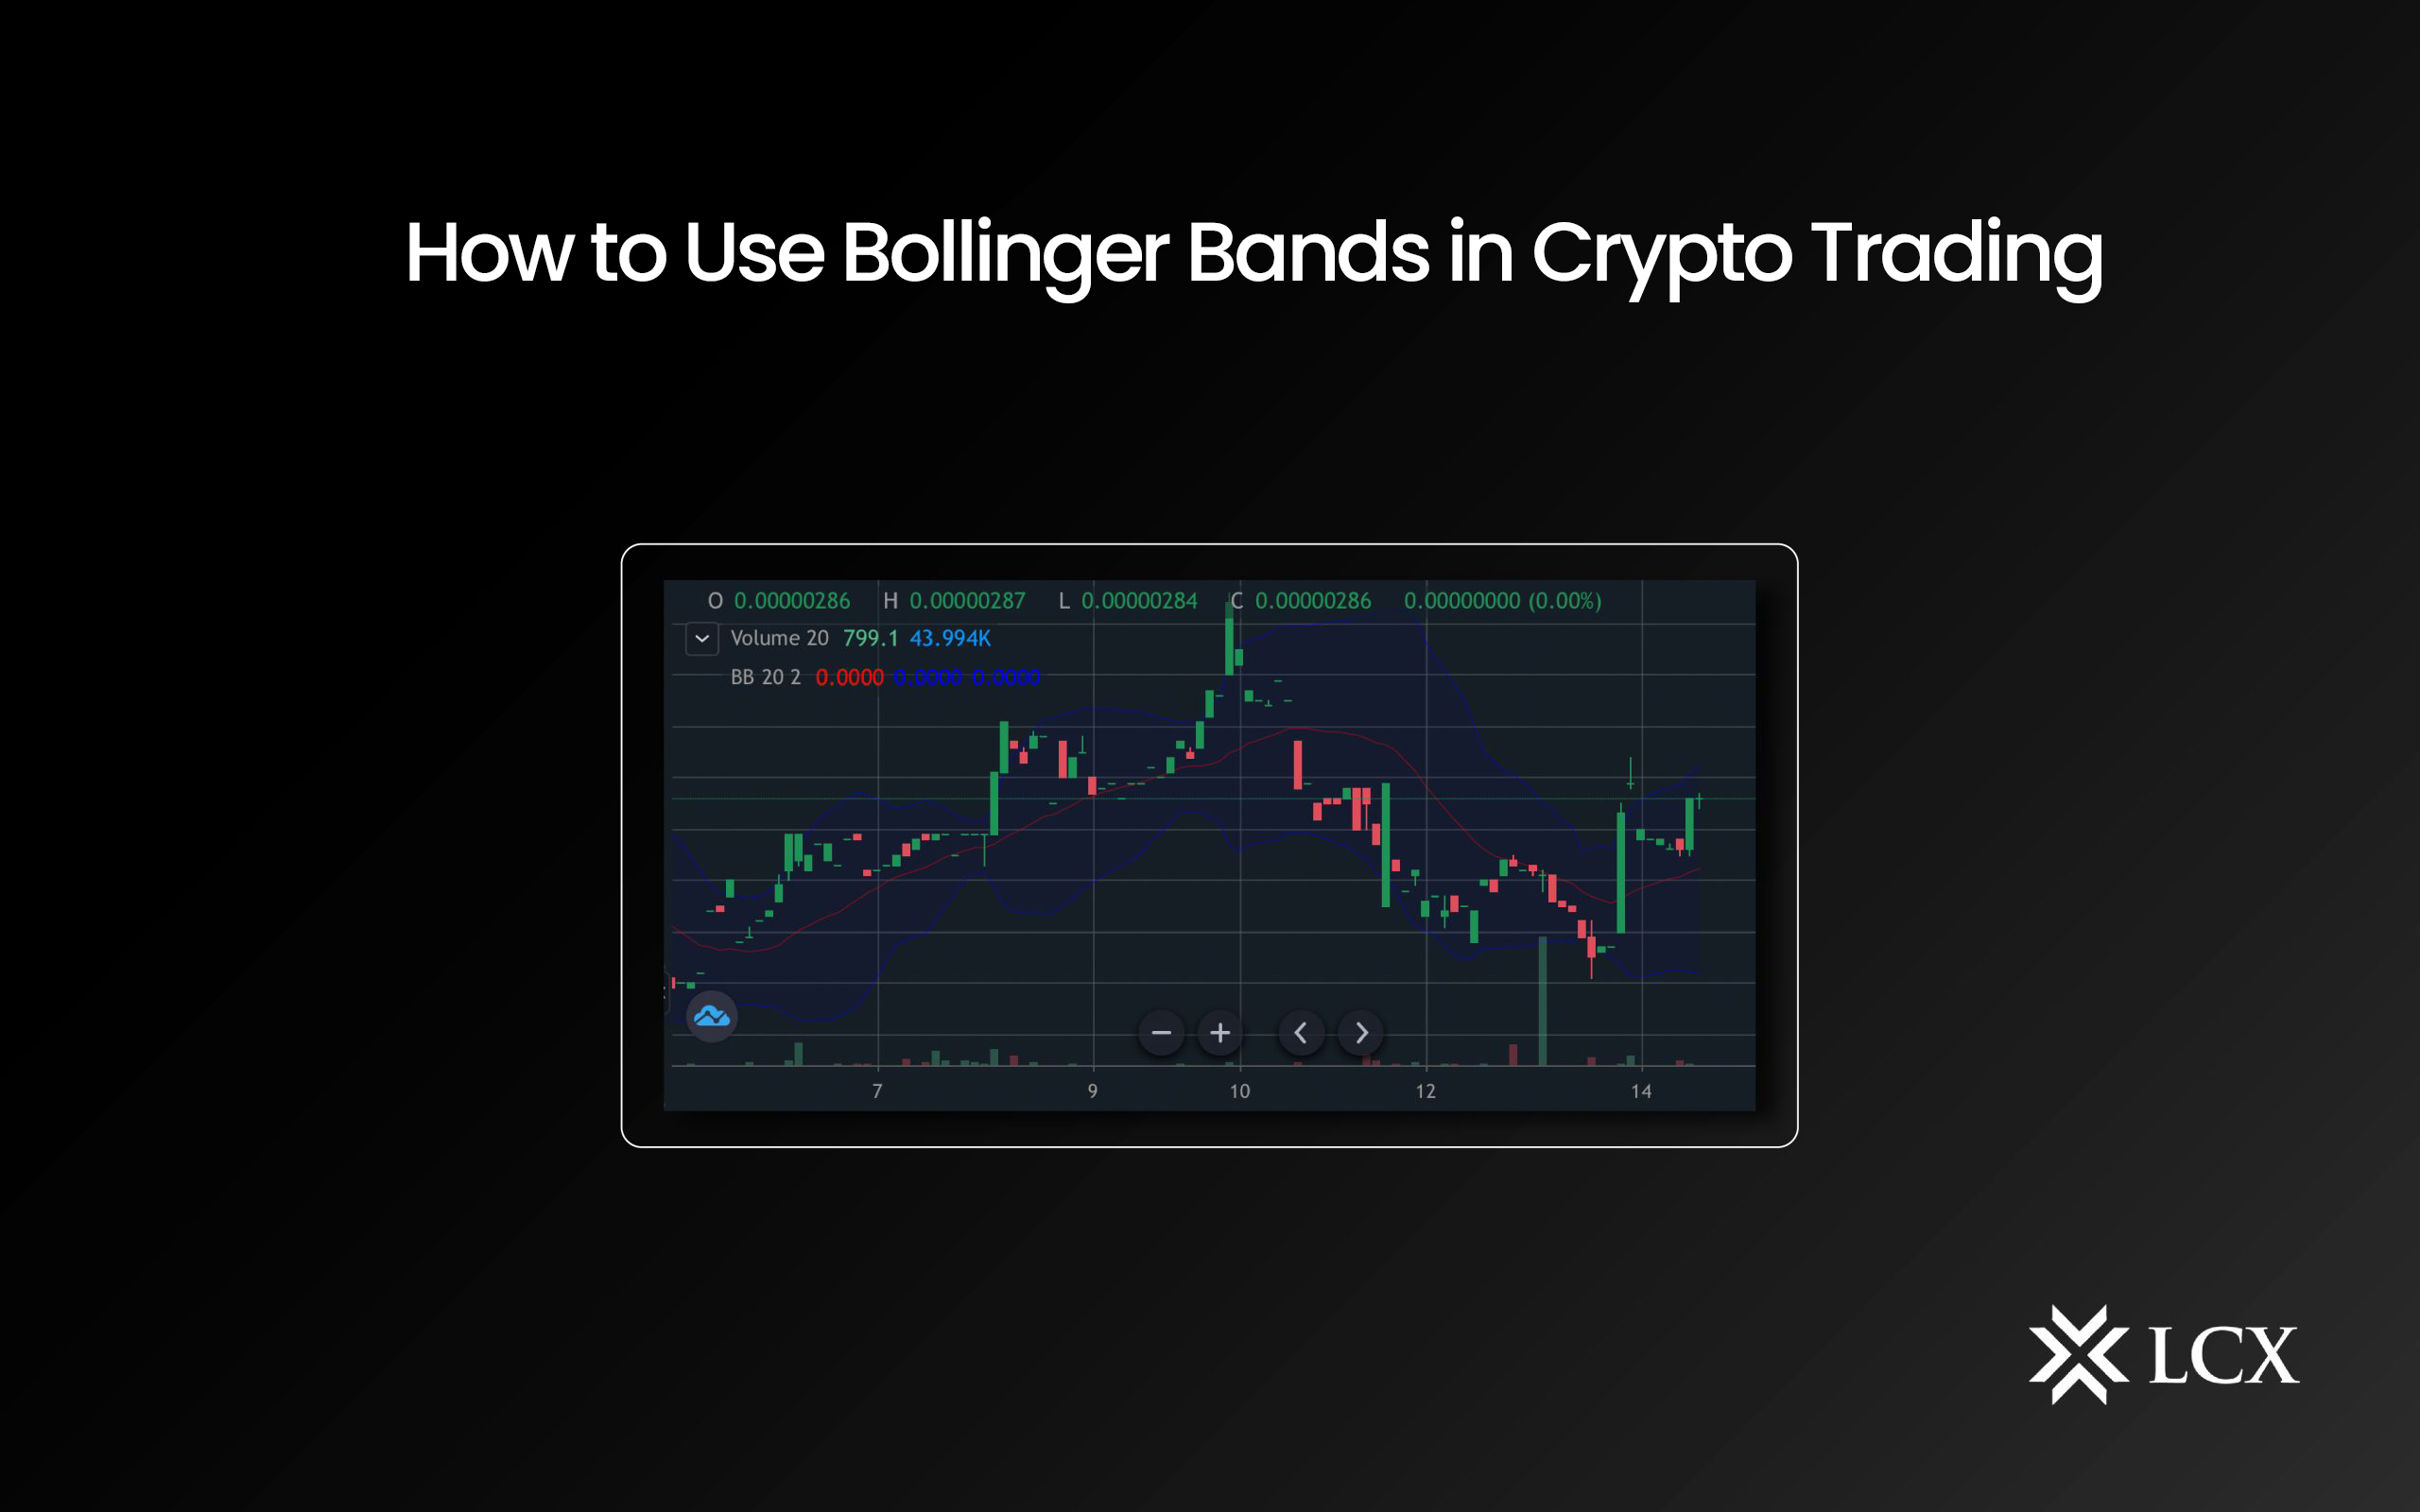
Bollinger Bands is a technical analysis tool that employs price volatility to predict trading entry and exit opportunities. They consist of two peripheral bands or lines and a centerline (the simple moving average for a 20-day period), which expands and contracts in response to price fluctuations. They are frequently utilized in conjunction with other technical indicators for comprehensive market analysis.
Bollinger Bands Explained
John Bollinger created Bollinger Bands in the 1980s. In cryptocurrency trading and other financial markets, they are a valuable technical analysis instrument used to evaluate price volatility, identify likely reversal points, and make trading decisions.
The following three bands contribute to the formation of a Bollinger Band:
Upper Band
Multiplying the middle band by the price’s standard deviation yields the upper band. The standard deviation measures the volatility of a price. Traders frequently use a multiplier of 2 for the standard deviation (SD), but this can vary based on market conditions and individual preferences.
The formula to calculate upper Bollinger Band
Upper Bollinger Band = SMA + (Multiplier X SD)
Middle Band (SMA)
Typically, the middle band represents the asset’s price over a specified period as a simple moving average (SMA). It functions as the axis and represents the average price of the cryptocurrency over the chosen time period.
The formula to calculate middle Bollinger Band
Middle Bollinger Band = (Sum of closing prices over a specified period)/ (Number of periods)
Lower Band
A multiple of the standard deviation is subtracted from the middle band to determine the lower band.
The formula to calculate lower Bollinger Band
Lower Bollinger Band = SMA – (Multiplier X SD)

Purpose of Bollinger Bands in Cryptocurrency Trading
Bollinger Bands serve as a crucial technical analysis tool in cryptocurrency trading, enabling traders to:
Assess Price Volatility
Bollinger Bands allow traders to evaluate the degree of price volatility on the cryptocurrency market. There may be trading opportunities when the bands widen, as this suggests greater volatility. A contraction of the bands, on the other hand, indicates less volatility and the possibility of price consolidation or trend reversals.
Identify Overbought and Oversold Conditions
Bollinger Bands are utilised to detect probable overbought and oversold scenarios, thereby assisting traders in their identification. When the price reaches or surpasses the upper band, indicating that it has been overbought, a potential selling opportunity may exist. On the other hand, if the price reaches or declines beneath the lower band, it can be considered oversold, indicating a potential purchase opportunity.
Determine Trend Direction
Traders may use Bollinger Bands to determine the direction of the current trend. If the price consistently moves within the upper band, this may indicate a bullish trend. Conversely, frequent contact with or proximity to the lower band may be indicative of a downtrend.
Generate Reverse Signals
Bollinger Bands can be utilised to generate reversal signals, which are indications of potential trend reversals. For instance, a possible reversal from an overextended condition may be indicated when the price exits the bands and then reenters them (below the lower band for a downtrend or above the upper band for an uptrend).
How Are Bollinger Bands Constructed?
Bollinger Bands are constructed using the simple moving average and standard deviation, which are the two fundamental building elements. These bands provide valuable information regarding price volatility and potential trading opportunities on the cryptocurrency markets.
Here is a detailed guide on how to construct Bollinger Bands:
Step One: Calculate the SMA
Traders select a particular time frame for analysis, such as daily, hourly, or another time frame, based on their trading strategy. For the specified time period, the previous closing prices for the cryptocurrency under consideration are compiled. Since it represents the last traded price at the end of each period, the closing price is commonly used.
The SMA is calculated by aggregating the closing prices for the selected time period and dividing by the number of data points. For example, if traders were analysing the daily closing prices of a cryptocurrency over a 20-day period, they would add the closing prices from the previous 20 days, divide by 20, and then determine the SMA for that day.
Step Two: Calculate the SD
After computing the SMA, traders determine the standard deviation of the closing prices during the same time period. The standard deviation, which is essential for assessing price volatility in cryptocurrency markets, measures the dispersion or variability of prices relative to the SMA.
Step Three: Construct the Upper and Lower Bollinger Bands
Multiplying the SMA by the standard deviation produces the upper Bollinger Band. As previously stated, the multiplier can be altered based on the preferences of the merchants and the current market conditions. To obtain the lower Bollinger Band, the same multiple of the SD is subtracted from the SMA.
Step Four: Plotting the Bollinger Bands on a Price Chart
After calculating the SMA, standard deviation, upper Bollinger Band, and lower Bollinger Band, traders can plot them on a price chart. The middle line represents the centerline of the Bollinger Bands and the Simple Moving Average. When the upper and lower bands are plotted above and below the SMA, a channel is created around the price chart.
Step Five: Interpretation
To comprehend how to trade cryptocurrencies using Bollinger Bands, it is essential to interpret price signals. For instance, when the price reaches or moves outside the upper band, it may indicate an overbought condition and a potential selling opportunity.
Conversely, if the price touches or moves outside of the lower band, it may indicate that the market is oversold, thereby presenting a potential purchasing opportunity. The width of the bands provides information about market volatility, with wider bands indicating greater volatility and narrower bands indicating lower volatility.
Crypto Trading Strategies With Bollinger Bands
Various Bollinger Bands-based crypto trading strategies employed by traders include:
The Bollinger Band Squeeze Strategy for Crypto
The Bollinger Band Squeeze strategy is predicated on the notion that periods of low volatility in crypto prices (known as a “squeeze”) are frequently followed by periods of high volatility (known as a “expansion”). It functions as follows:
Find the squeeze: Observe instances in which the Bollinger Bands contract and move closer together, an indication of decreased price volatility.
Prepare for a breakout: Following a compression, investors anticipate a significant price change. They do not anticipate the direction of the outbreak, but they are prepared for it.
Entry points: Traders enter positions following price breakouts from Bollinger Bands (above the upper band for an uptrend, below the lower band for a downtrend), frequently utilising additional confirmation indicators, such as volume.
Stop-loss and take-profit: Employ stop-loss orders to limit potential losses if the breakout fails to hold, and establish take-profit levels in accordance with one’s trading strategy.
Bollinger Bands for Setting Entry and Exit Points in Crypto Trades
Bollinger Bands can be used to determine the optimal entry and exit positions in cryptocurrency trading, whether for short-term investments or day trading.
Entry points
When the price reaches or breaks below the lower Bollinger Band, indicating a situation of oversold conditions, traders may look for purchase signals. When the price reaches or exceeds the upper Bollinger Band, they consider overbought conditions to be sell signals. However, additional technical investigation and validation may be required.
Exit points
Traders can use Bollinger Bands to determine when to terminate a position. For example, if speculators are long a cryptocurrency and the price is approaching the upper band, it may be time to take profits. In contrast, if they are short and the price is approaching the lower band, it may be time to close the position.
Combining Bollinger Bands With Other Trading Indicators
Traders frequently use Bollinger Bands in conjunction with other indicators to complement their trading strategies.
Bollinger Bands and Relative Strength Index
The combination of Bollinger Bands and the relative strength index (RSI) may assist traders in identifying potential reversals. For instance, if the price is nearing the upper Bollinger Band and the RSI indicates overbought conditions, a probable decline may be indicated.
Volume analysis
Bollinger Bands and trading volume analysis can be used to validate price fluctuations. A volume increase during a Bollinger Band breach may bolster the signal’s reliability.
Bollinger Bands and Moving averages
Traders use moving averages in conjunction with Bollinger Bands to add more context to trend analysis. Bollinger Bands and a moving average crossover technique, for example, can help confirm trend changes.
Limitations of Bollinger Bands for Crypto Traders
Bollinger Bands are a useful instrument for cryptocurrency traders, but they are not without their flaws. First, they may generate false signals during periods of low volatility or when markets are moving rapidly, which may result in losses. Second, traders must use additional indicators or analysis techniques to corroborate the direction of the trend, as they do not provide directional information on their own.
Additionally, the effectiveness of Bollinger Bands may vary across cryptocurrencies and timeframes. In addition, unanticipated market news or events may cause price disparities that are not necessarily reflected in the bands, which may surprise traders.
Risk Management Strategies When Using Bollinger Bands
As with any technical indicator, cryptocurrency traders must employ Bollinger Bands alongside rigorous risk management and analysis. Traders should set up explicit stop-loss orders to reduce potential losses in the event that their transactions go against them.
Position sizing is also crucial; in order to avoid overexposure, traders must designate a certain amount of capital to each trade. In addition, risk can be mitigated by diversifying among various cryptocurrencies and limiting the amount of capital that can be lost in a single trade.
Bollinger Bands should always be utilized in conjunction with other confirmation indicators and larger market patterns. Achieving long-term success with Bollinger Bands requires sustaining discipline and adhering to a distinct risk management strategy.