Basic Guide To Doji Candlestick Pattern
oleh LCX Team ·
A doji candle pattern, also known as a “doji star,” denotes the lack of agreement between the bulls and bears of the cryptocurrency or financial market. This candlestick chart pattern only appears when a market’s close and open prices are nearly identical. In order to spot potential market reversals, financial markets use this technical analysis tool. Since the high, low, open, and close prices are all the same, a doji candlestick is typically used to denote uncertainty.
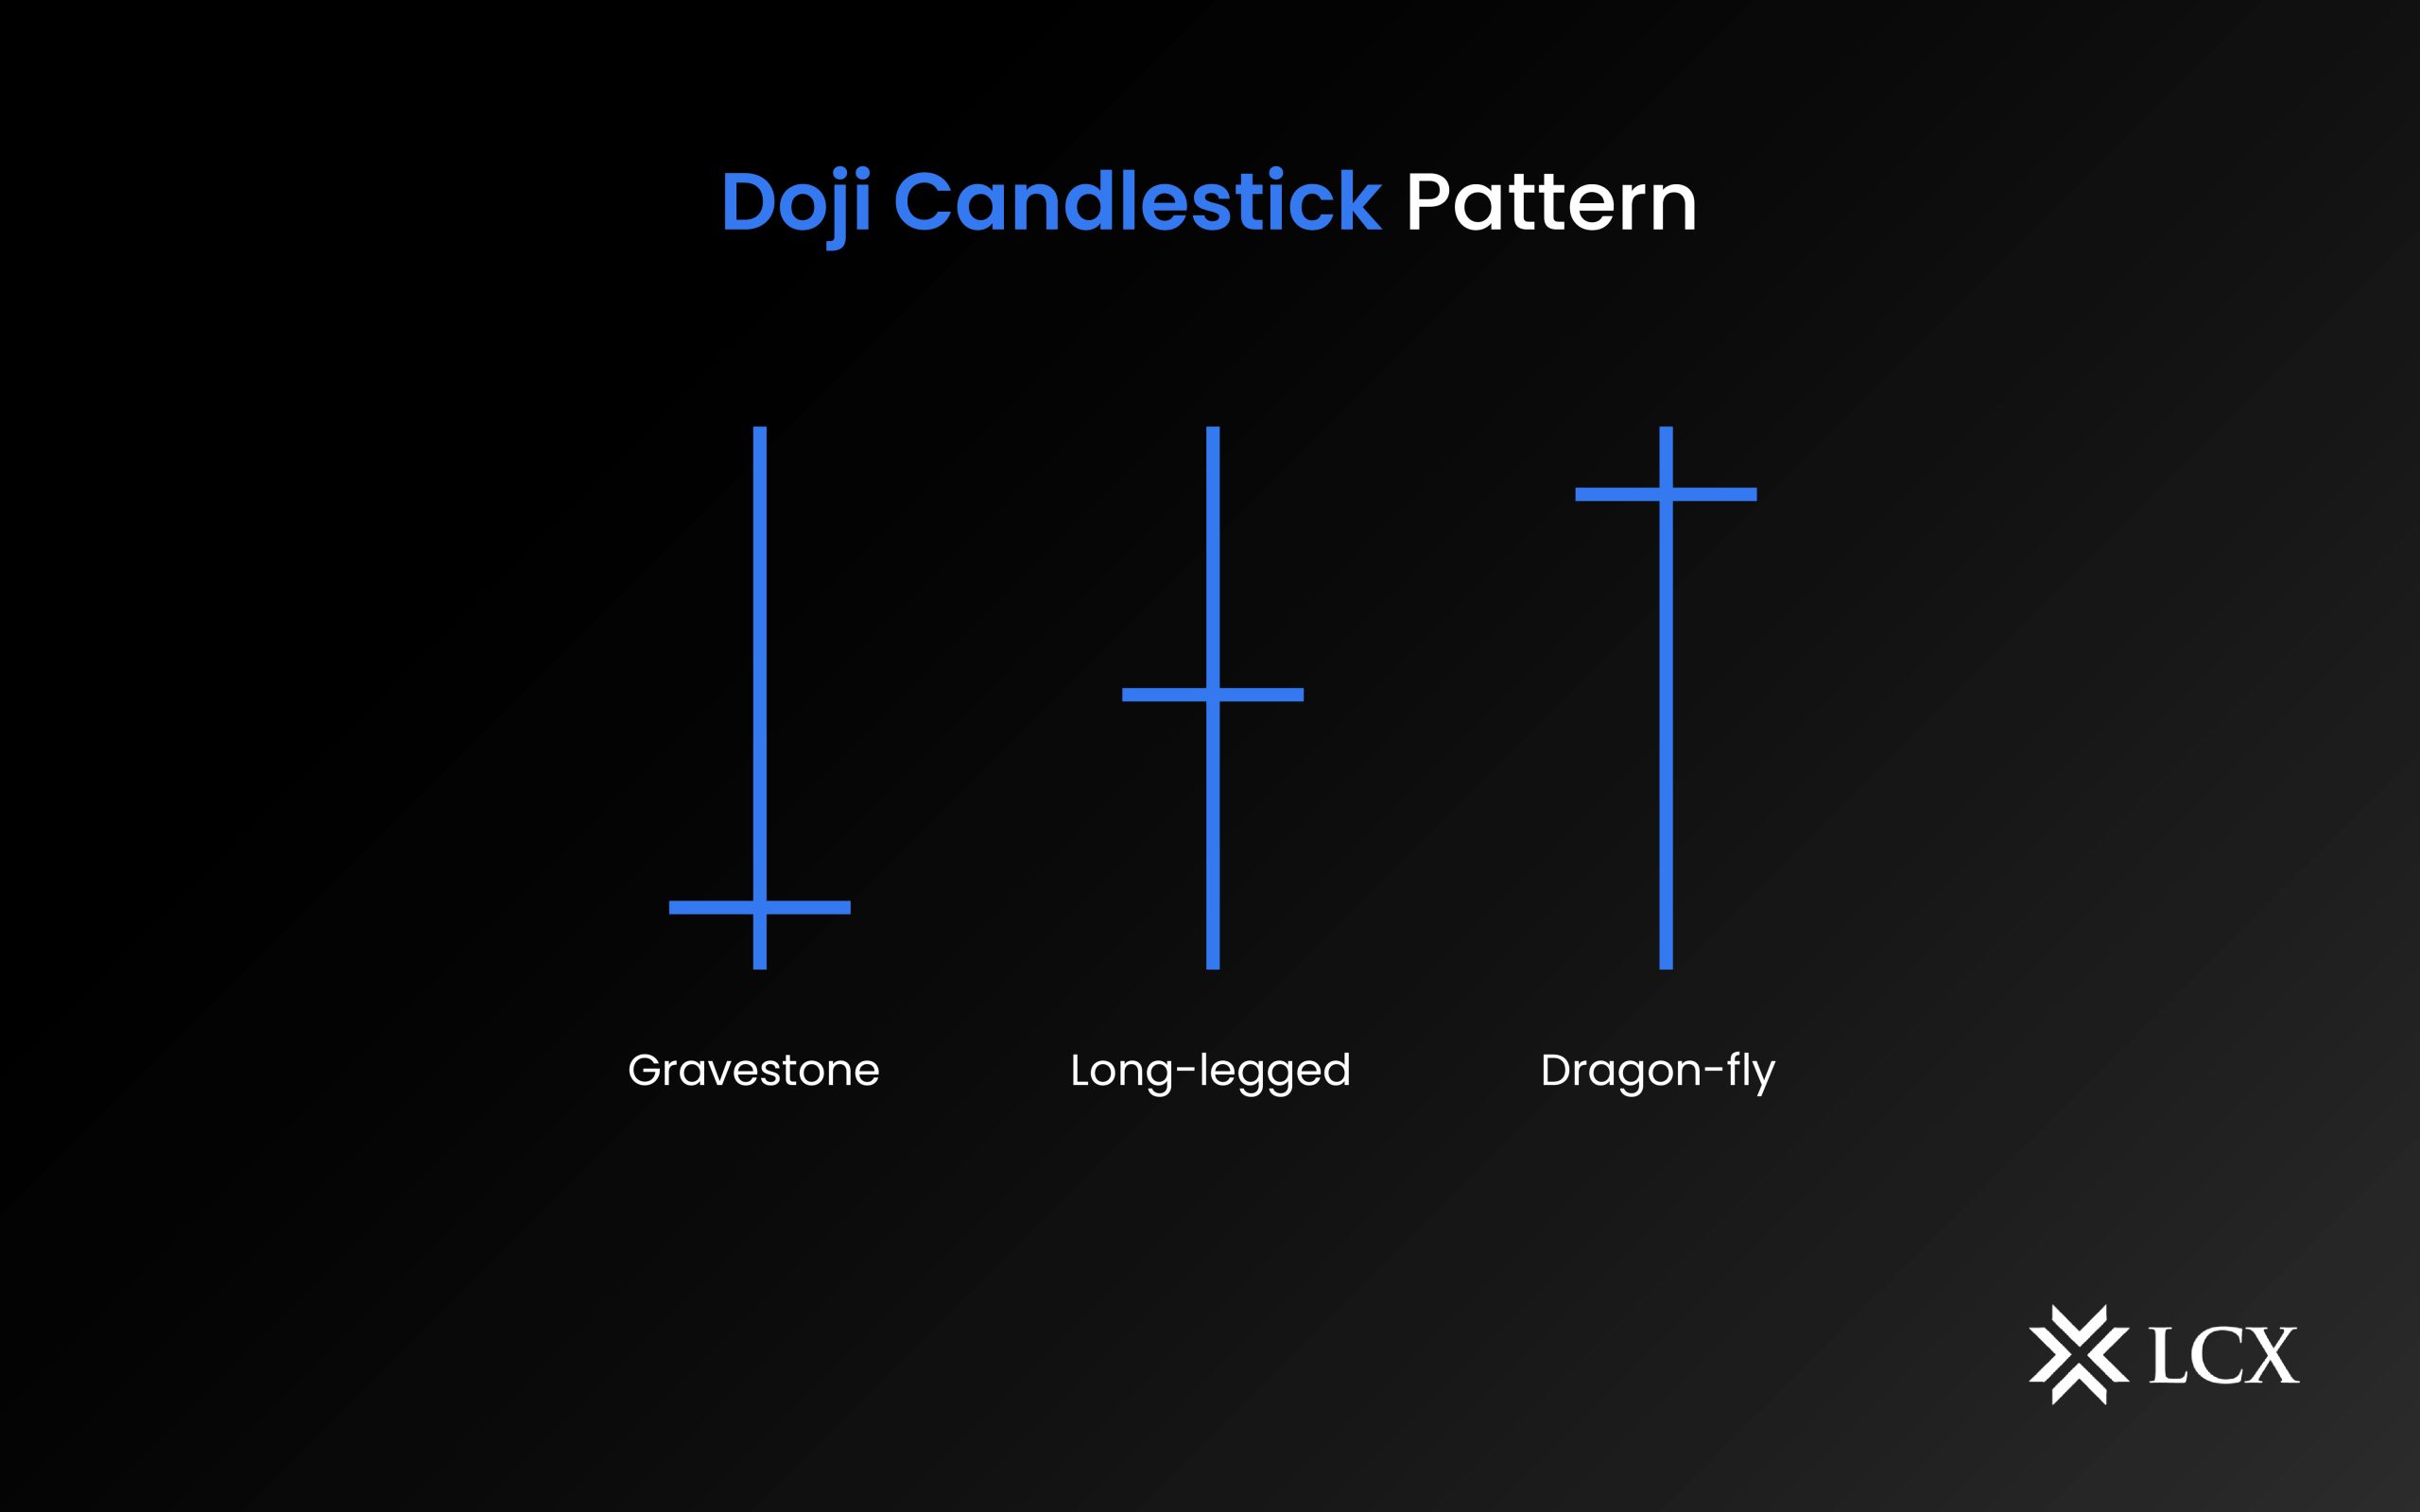
There are numerous Doji patterns, such as the long-legged, gravestone, and dragonfly Doji. Even so, not every Doji variant is utilized in the same manner. In fact, Doji can also be used to show that a trend is losing momentum. To reduce risks and consistently make a profit, you must comprehend and interpret the differences between these formations. This article will define a Doji, describe its traits, and discuss how traders can use it to make wise trading decisions.
What is a Doji Candlestick pattern?
A Doji candle is a type of candlestick formation that appears when the open and close prices are nearly equal and the shadows are sufficiently long. The horizontal line of the Doji pattern is referred to as the body, and the vertical line is known as the wick.
Normally, a doji candlestick appears as the market opens, and bullish traders drive the prices higher. When bearish traders attempt to reject the higher price, the price pushes lower. The body of the Doji candle displays the variations between an asset’s opening and closing prices. The bottom wick represents the low price, and the top wick the highest price.
When an asset’s price open and close are roughly at the same level, a cross shape is then created. The cross shape takes the form of a candle with an extremely small or almost nonexistent body and equal-length upper and lower wicks.

What is the origin of the name “Doji Candlestick”?
A Doji, or “dоji” in Japanese, is referred to as a candlestick that has an equal open and close and frequently forms part of patterns. In Japanese, the word “doji” (which translates as “blunder” or “mistake”) denotes the rarity of an exact match between a closing and opening price. In the end, a transitional candlestick serves as the primary indicator of the market’s bulls’ and bears’ equality and indecision.
What are the different types of Doji Candletstick patterns?
There are several types of Doji candles, each with its own unique characteristics:
- Neutral Doji: The neutral Doji has an almost invisible body in the middle of the candle, meaning that the lengths of the upper and lower shadows are comparable. When there is a balance between bullish and bearish sentiment, this pattern appears.
- Dragonfly Doji: This type of Doji is considered bullish, as it has a long lower wick and a small or non-existent upper wick.
- Long legged Doji: This type of Doji has long upper and lower wicks, indicating significant market indecision.
- Four Price Doji: This type of Doji is rare and occurs when the open, high, low, and close prices are all the same. It signals a complete lack of price movement.
What is the difference between a Doji Candle vs Hammer Candle?
Due to their tendency to blend into the background and their similar short stature, doji and hammer candles may appear similar. However, a hammer candle has a long lower shadow that is almost twice the size of a real body. Usually, following a price decline, a hammer candlestick appears, indicating a potential future reversal. It signifies a candlestick pattern’s bullish reversal, which typically happens at the bottom of downtrends. The hammer candle is useful for alerting traders to the potential end of a downtrend and for helping traders visualize where support and demand are. Doji, however, is always visible. The distinction between a Doji and a Shooting Star, which is an inverted hammer and a bearish reversal signal, is the same.
In Conclusion
In conclusion, the Doji candle pattern is an important tool for crypto traders looking to identify potential trend reversals. By understanding the different types of Doji and how they can be used in combination with other analysis techniques, traders can gain a deeper understanding of market sentiment and make informed trading decisions. Doji can be used as a standalone indicator or in combination with other technical analysis tools to make informed trading decisions. When using Doji, it is important to consider the context in which it occurs, the time frame being analyzed, and the market conditions.