Advance/Decline Trade Indicator Explained
przez LCX Team ·
The Advance/Decline (A/D) trade indicator is a technical analysis tool that compares the number of securities that have advanced in price to the number that have declined. This indicator is typically used to gauge the overall strength or weakness of a market or sector. In the crypto market, the A/D indicator can be used to identify potential buying or selling opportunities by analyzing the number of cryptocurrencies that are rising or falling in value. It is based on the daily performance average and is typically used with 1D (daily) charts.
Understanding the Advance/Decline Indicator
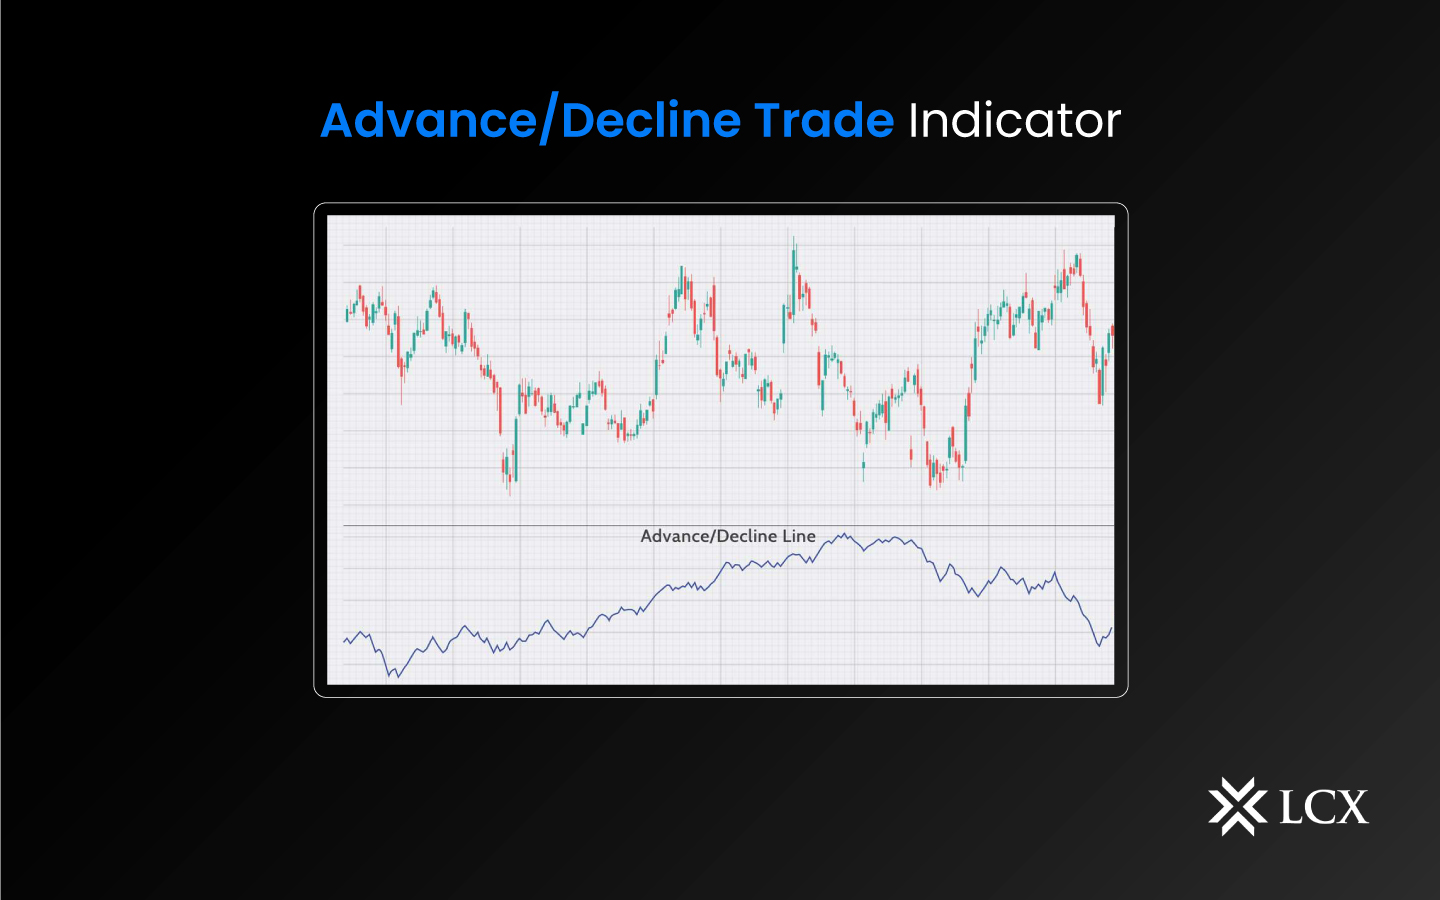
To utilize the potential of the A/D indicator in the crypto market, users need to look for divergences between the A/D line and the price of a particular cryptocurrency. A bullish divergence occurs when the A/D line is making new highs while the price of the cryptocurrency is still in a downtrend. This indicates that more and more cryptocurrencies are gaining in value, despite the overall bearish trend.
On the other hand, a bearish divergence occurs when the A/D line is making new lows while the price of the cryptocurrency is still in an uptrend. This indicates that more and more cryptocurrencies are losing value, despite the overall bullish trend.
Another way to use the A/D indicator in the crypto market is to look for trends in the A/D line. A sustained uptrend in the A/D line indicates that more and more cryptocurrencies are gaining in value, which may be a sign of a bullish market. On the other hand, a sustained downtrend in the A/D line indicates that more and more cryptocurrencies are losing value, which may be a sign of a bearish market.

Calculating the Advance/Decline Indicator in Crypto Trading
The formula to calculate the A/D trade is:
A/D line = Advancing Securities – Declining Securities + Previous Net Advances
Where,
Advancing Securities refers to the number of securities that increased in value on a daily basis;
Declining Securities refer to the number of securities that decreased in value on a daily basis;
Previous Net Advances refer to the net amount of advancing and declining securities on a daily basis.
The LCX exchange offers integrated TradingView charts and allows traders to use indicators like advance/decline indicators and more while trading to let them tap into their full potential at trading. Users can use the LCX exchange for starters and pick among multiple trading pairs on the tab. Click on the “indicators” dropdown at the top and click on “Advance/Decline Indicator”
Conclusion
The Advance/Decline indicator is a valuable metric in understanding the overall strength of the crypto market. By tracking the number of advancing assets compared to declining assets, traders can gain insight into market sentiment and make informed decisions. As with any indicator, it should be used in conjunction with other technical analysis tools to form a complete picture of market conditions.