Accumulation/Distribution Trade Indicator Explained
โดย LCX Team ·
The Accumulation/Distribution (A/D) indicator is a technical analysis tool that helps traders identify potential buying and selling opportunities in the cryptocurrency market. It does this by measuring the flow of money into and out of a particular asset. In this blog post, we will discuss how the A/D indicator works and how it can be used to make more informed trades in the crypto market.
The A/D indicator is a type of momentum indicator that measures the flow of money into and out of an asset. It is based on the principle that, when an asset is accumulated (bought), the price will increase, and when it is distributed (sold), the price will decrease. The A/D indicator calculates the net difference between buying and selling pressure by comparing the closing price to the high and low of the day.
The Accumulation Distribution Line was created by famed stock analyst Marc Chaikin. The ADL has become closely related to two of Chaikin’s other famous indicators; the Chaikin Oscillator and the Chaikin Money Flow indicator.

How is Accumulation/Distribution trade indicator calculated?
To calculate the accumulation/distribution trade indicator, the first step would be to calculate the money flow multiplier by using the previous closing, high, and low prices of an asset. The formula to calculate the money flow multiplier is:
(Closing Price – Low price of the period) – (High price of the period – Closing Price) / (High price of the period – Low price of the Period)
Next, the money flow volume is calculated using the current period’s volume and the value of the multiplier calculated in the previous step. Thus, Money Flow Volume = Money Flow Multiplier × Period Volume.
Finally, the A/D line is plotted on a chart by cumulatively summing the money flow volume for each day. Thus, A/D = Previous A/D + Money Flow Volume (current).
How to use the Accumulation/Distribution trade indicator?
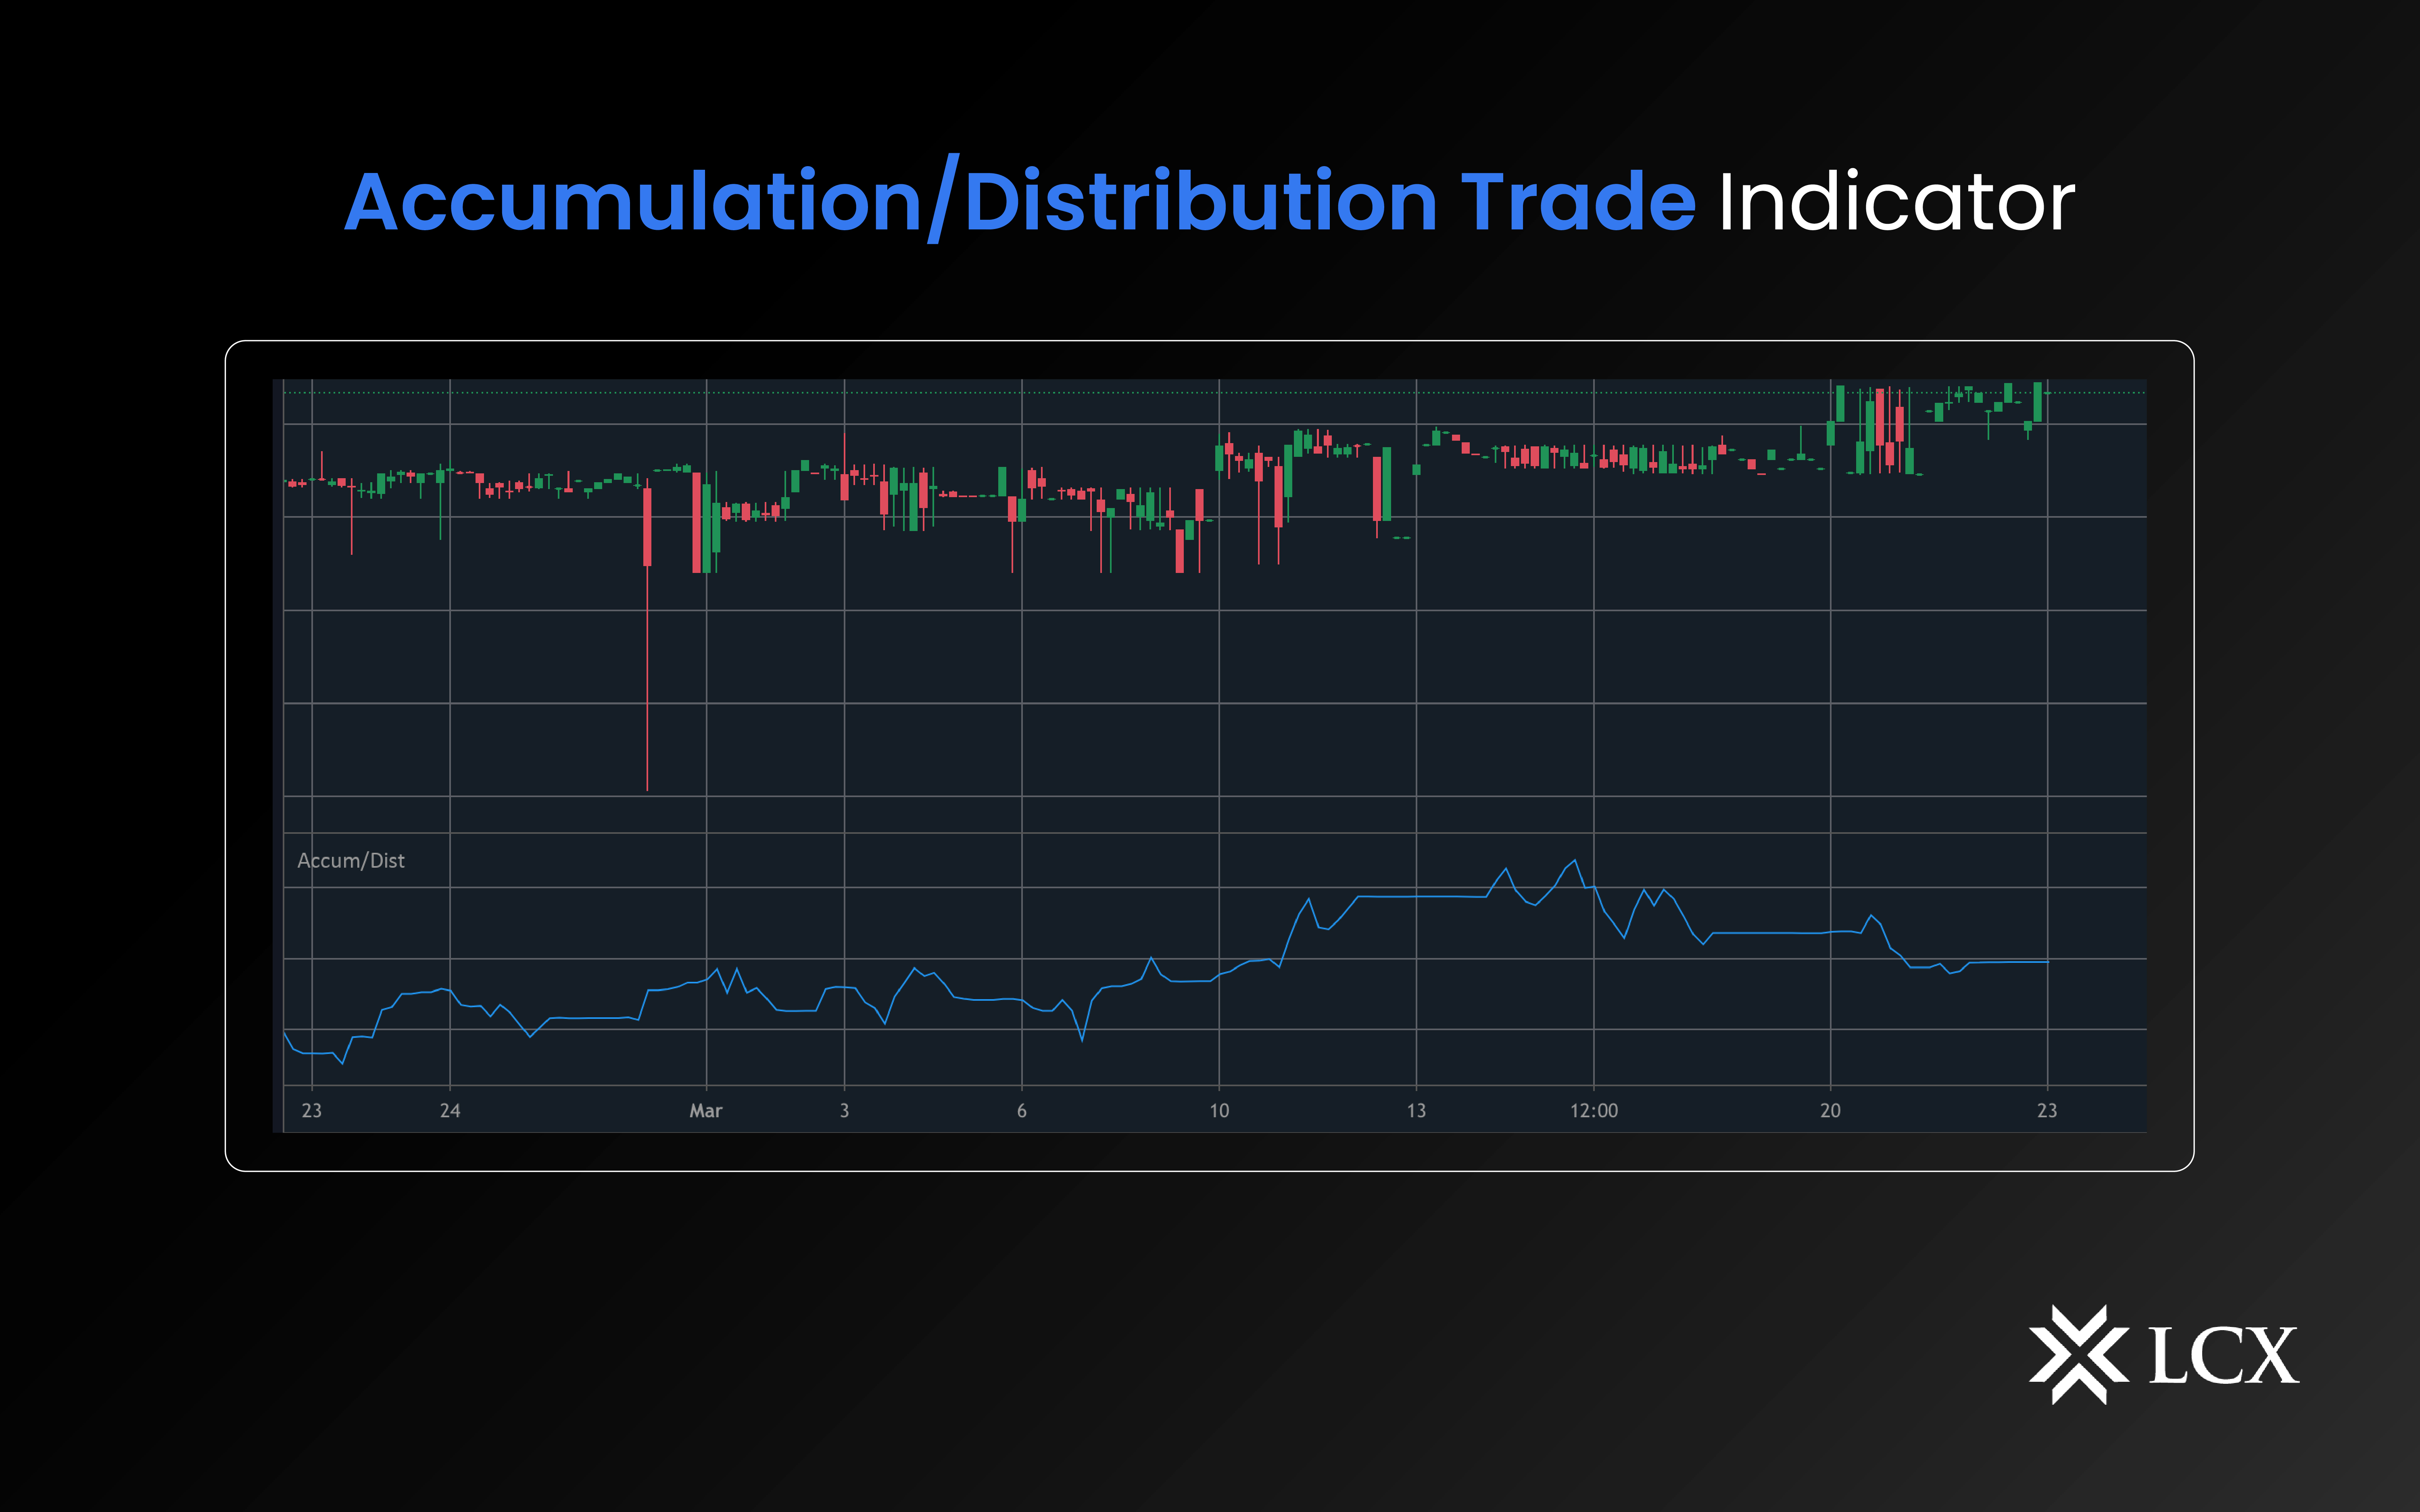
The A/D indicator can be used to identify potential buying and selling opportunities in the crypto market. Here are a few ways to interpret the A/D indicator:
- Rising A/D line: A rising A/D line indicates that there is more buying pressure than selling pressure, and the price is likely to increase.
- Falling A/D line: A falling A/D line indicates that there is more selling pressure than buying pressure, and the price is likely to decrease.
- Divergences: Divergences between the A/D line and the price can also be used to identify potential buying and selling opportunities. For example, if the price is making new highs while the A/D line is not, it could indicate that the uptrend is losing steam and that a reversal may be imminent.
The LCX Exchange offers integrated TradingView charts and allows traders to use indicators like accumulation/distribution and more while trading to let them tap into their full potential.
In Conclusion
The Accumulation/Distribution indicator is a powerful tool for identifying potential buying and selling opportunities in the crypto market. By measuring the flow of money into and out of an asset, the A/D indicator can help traders identify potential price movements. However, it’s always important to use the A/D indicator in conjunction with other technical analysis tools and to practise proper risk management techniques.