What is Ichimoku Cloud Indicator
von LCX Team ·
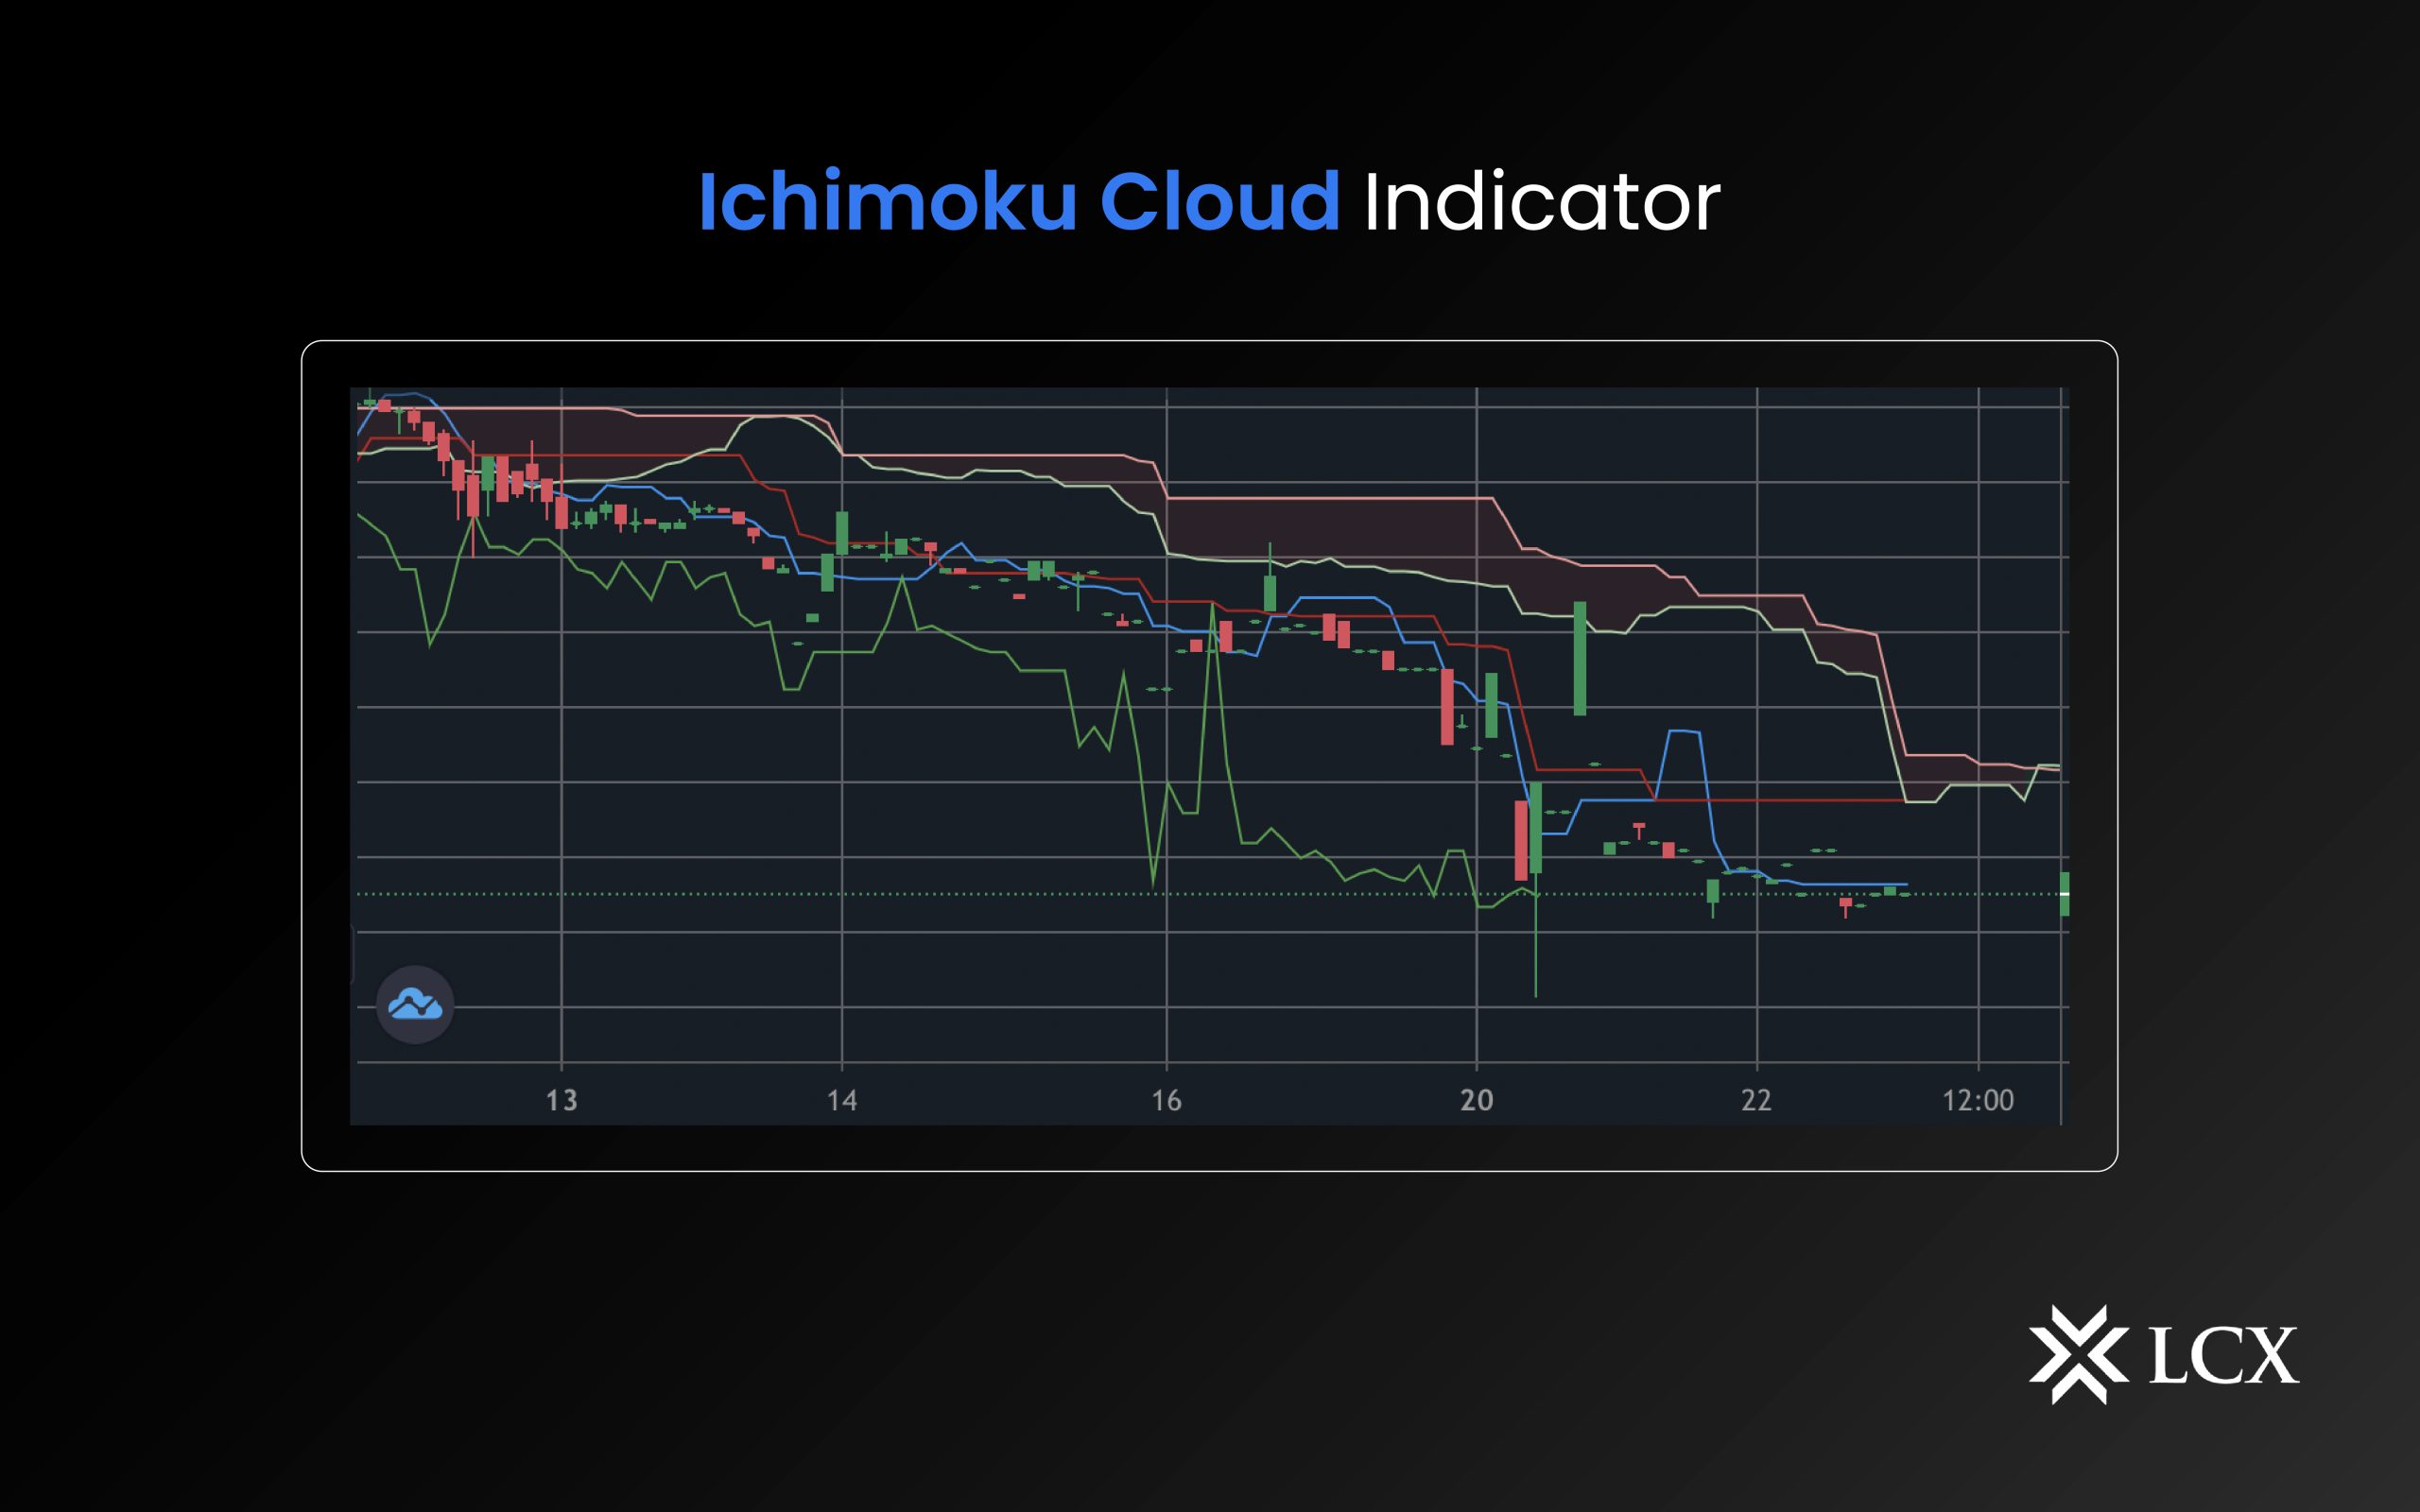
The Ichimoku Cloud trade indicator is often referred to as one of the most complex trade indicators, as it involves studying more data points than other indicators. It is one of the most advanced technical indicators, and its basic function is to collect various types of data and present them in a chart format with color-coded lines and areas. The chart signifies various trading signals and serves as a means of determining support and resistance zones, uptrend and downtrend predictions, and the identification of overbought and oversold levels.
How does the Ichimoku cloud indicator work?
Ichimoku Kinko Hyo, also known as the “Ichimoku Cloud,” is used to gauge the momentum and trend of an asset. It was developed by Goichi Hosoda, a Japanese journalist, and was originally published in his 1969 book, “Ichimoku Sanjin.” The Ichimoku Cloud is a technical indicator that consists of five lines:
- The Tenkan-sen line, also known as the Conversion Line, is a short-term moving average that reflects the average price of an asset over the past nine periods.
- The Kijun-sen line, also known as the Base Line, is a medium-term moving average that reflects the average price of an asset over the past 26 periods.
- The Chikou Span, also known as the Lagging Span, is a line that plots the closing price of an asset 26 periods behind the current period.
- The Senkou Span A, also known as the Leading Span A, is a line that plots the midpoint between the Conversion Line and the Base Line, projected 26 periods ahead.
- The Senkou Span B, also known as the Leading Span B, is a line that plots the midpoint between the highest high and lowest low of the past 52 periods, projected 26 periods ahead.
Together, these lines form what is known as the “cloud,” which is shaded in on the chart to highlight areas of potential support and resistance.

What can traders learn from Ichimoku cloud indicators?
Here is a list of a few things traders can learn from the complex Ichimoku cloud indicators:
- Trend direction: The direction of the cloud can indicate the overall trend of the market. If the cloud is sloping upwards, it indicates an uptrend, while a downward-sloping cloud indicates a downtrend.
- Support and resistance: The cloud can act as a dynamic support or resistance level, with the upper edge of the cloud serving as resistance and the lower edge serving as support.
- Momentum: The position of the Conversion Line and the Base Line relative to each other can indicate the momentum of the market. If the Conversion Line is above the Base Line, it indicates bullish momentum, while if the Conversion Line is below the Base Line, it indicates bearish momentum.
- Breakouts: The cloud can also be used to identify potential breakouts. If the price breaks above the upper edge of the cloud, it can signal a potential breakout to the upside. Similarly, if the price breaks below the lower edge of the cloud, it can signal a potential breakout to the downside.
- Crossovers: Crossovers between the Conversion Line and the Base Line can also be used as a buy or sell signal. If the Conversion Line crosses above the Base Line, it can be a bullish signal, while if the Conversion Line crosses below the Base Line, it can be a bearish signal.
In Conclusion
The Ichimoku cloud has gained a reputation for being one of the most powerful and versatile technical indicators. The reputation is well deserved as it takes into account many different variables and can show several different trading signals, which can sometimes contradict each other. Mastering the Ichimoku cloud is, therefore, far from easy, and no one indicator can predict the correct trend for cryptocurrency. Thus, it is advisable to use the trading indicator in conjunction with other indicators for the best results.