What Is the Relative Strength Index (RSI) Indicator?
kwa LCX Team ·
Cryptocurrencies, especially, are known for their volatility. Crypto trading is often conducted with the intention of taking advantage of these price movements where traders attempt to predict them. Trading indicators have served as useful tools for traders since trading has existed to help them make informed predictions about their positions. LCX exchange comes with integrated TradingView charts which allow the trader to use various technical indicators while trading on the exchange. To begin, you must understand the basic crypto metrics. To get the nitty-gritty of common crypto metrics, read here: Most Common Crypto Metrics – LCX
Cryptocurrencies have also contributed to this development. For a successful start, it is crucial to understand what indicators are, how they work, and what they are used for. This article covers one of the most commonly used trading indicators, RSI.
The first step is to understand what trading indicators are.
What are trading indicators?
The purpose of a trading indicator is to indicate the direction of a market using graphs and mathematical formulas. Crypto traders and investors analyze market conditions using an indicator and a trading chart. To anticipate future price trends and patterns, it is necessary to analyze past market movements, which is what trading indicators do.
It is important to mention that, while indicators can provide insight into where the market is heading, they cannot be relied upon to accurately predict the price of Bitcoin or other crypto assets. Overall, the goal is to assist traders in identifying trading opportunities so that they can maximize profit while minimizing losses.
What is the Relative Strength Index (RSI) Indicator?
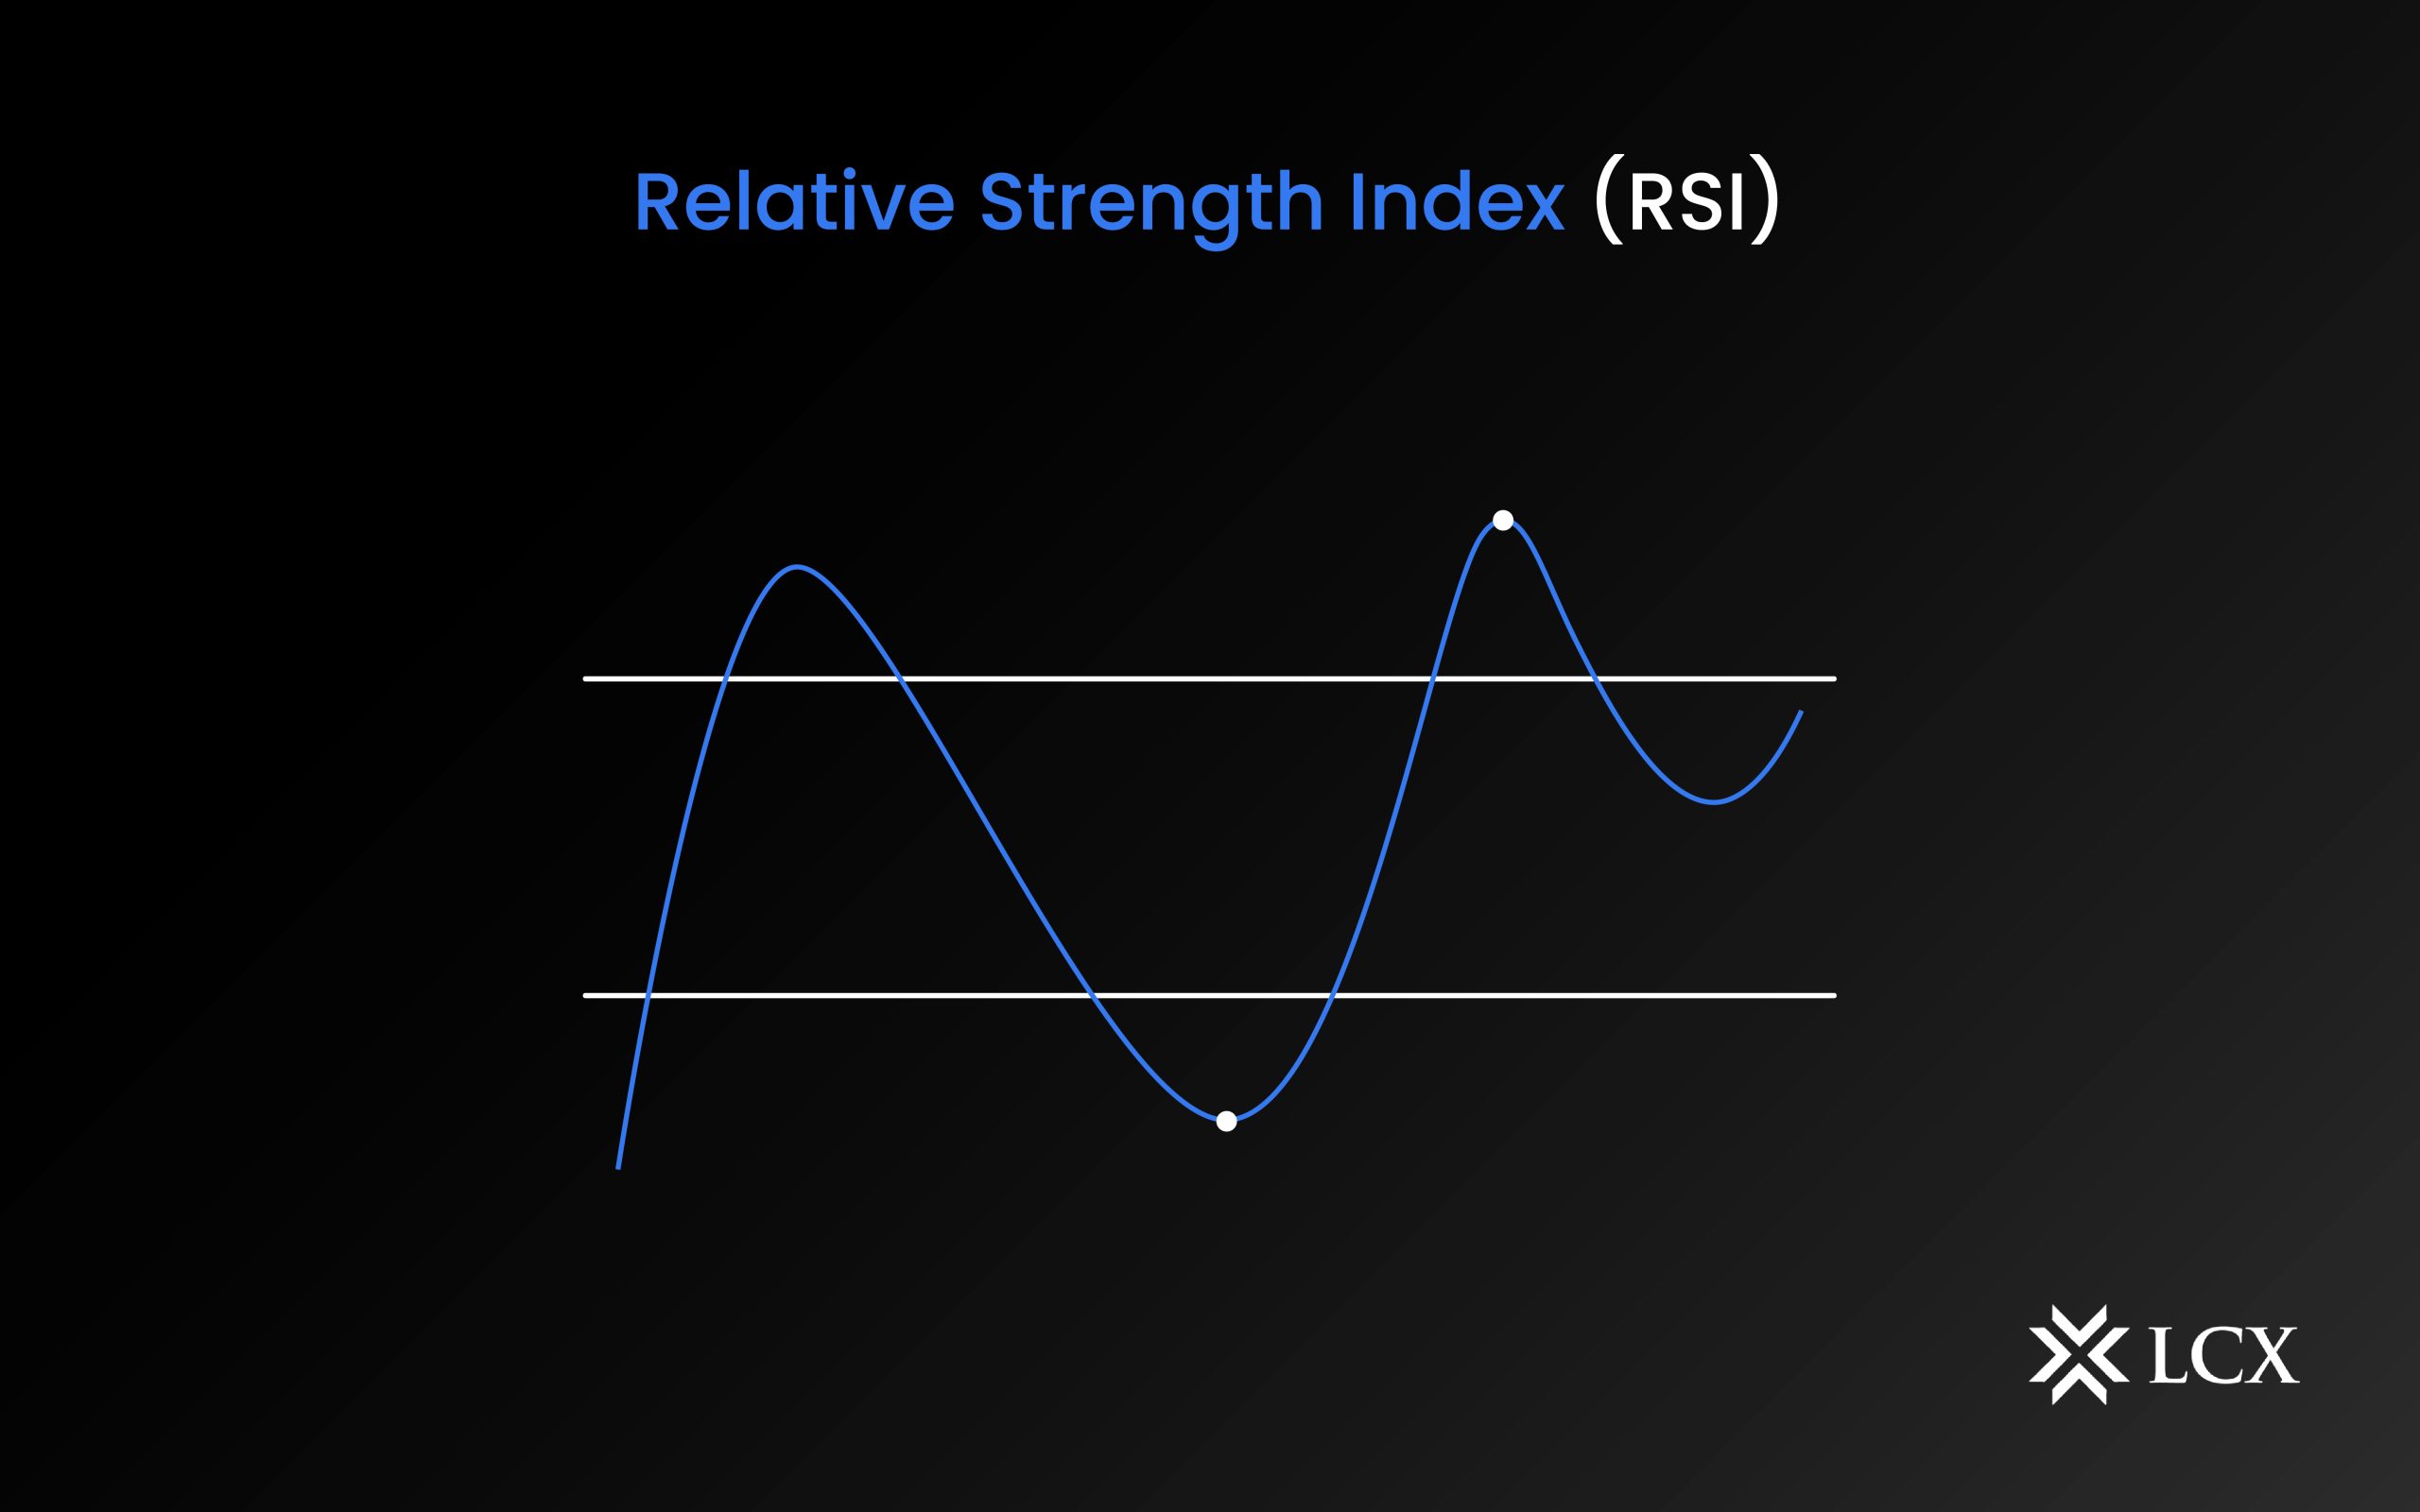
The relative strength index (RSI) is a technical analysis indicator commonly used in crypto trading for estimating Market Momentum. It evaluates overvalued or undervalued conditions in the price of crypto assets based on the speed and magnitude of their recent price changes. Created by J. Welles Wilder Jr, the indicator is presented as an oscillator (a line graph) on a scale of zero to 100. Like many other technical indicators, this tool was also introduced in the book “New Concepts in Technical Trading Systems”, published in 1978.
RSI can also signal a reversal in trend or a corrective pullback in price. Buying and selling signals can be obtained from it. A reading of 70 or higher on the RSI indicates overbought conditions. When the reading is below 30, there is an oversold condition.
How to calculate the Relative Strength Index (RSI)?
The relative strength index is a momentum indicator that compares an asset’s strength on days when prices are rising with its strength on days when prices are declining. This comparison can provide traders with insight into how a cryptocurrency might perform based on its price action. Trading decisions can be improved when RSI is coupled with other technical indicators.
Calculating RSI is a two-step process that begins with the following formula:
- RSI = 100− [ 100 / 1 + Average loss / Average gain ]
- RSI = 100− [ 100 / 1 + (Previous Average Gain×13) + Current Gain / (Previous Average loss×13) + Current loss]
Why do crypto traders use RSI Indicators?
Cryptocurrency traders often need to determine the price behavior of the crypto asset, and this is where RSI can be used to predict the price behavior. Traders can use the RSI Indicator to validate trends and identify reversals in trends. Short-term traders can use RSI Indicators to identify overbought and oversold cryptocurrencies. Trading strategies can be developed by combining RSI with other indicators.
Final Thoughts
The RSI is among the most important tools in many traders’ toolkits for understanding price momentum. Considering that momentum is a key consideration in cryptocurrency trading, it is particularly appropriate for cryptocurrency. However, it is important to remember that due to the indicator’s ability to display momentum, it can remain overbought or oversold for much longer periods of time when an asset is moving strongly in any direction. Therefore, RSI is most useful when asset prices are fluctuating between bullish and bearish movements throughout a trading range (a market oscillation). Traders can use indicators to make better decisions, but they cannot be completely relied upon.