


BTC price support holds ahead of US CPI data: Three things Bitcoin traders need to know this week

Bitcoin (BTC) starts the third week of October by defending support at $82,500 ahead of key US inflation data.
Key points:
- US CPI print on Wednesday and PPI data on Thursday provides the week’s major risk-asset volatility catalyst, with markets seeing CPI at 3.7% year-on-year.
- Oil prices react to the US plan to buy Russian diesel, but WTI crude heads higher after dropping below $90 per barrel on Monday.
- Bitcoin seals a weekly close above key support at $82,500, avoiding a drop into its previous 2026 macro range between $60,000 and $80,000.
Markets see September inflation creeping higher
US inflation data is in traders’ crosshairs this week ahead of the Federal Open Market Committee’s Oct. 28 meeting on interest-rate policy.
The September prints of the Consumer Price Index (CPI) and Producer Price Index (PPI) will be released on Wednesday and Thursday, respectively.
In August, CPI broadly conformed to expectations at 3.4% year-on-year, with markets now seeing an uptick to 3.7% this month on the back of ongoing military action in the Middle East and associated fuel-price surges. PPI is expected at 0.3% month-on-month versus 0.2% in August.
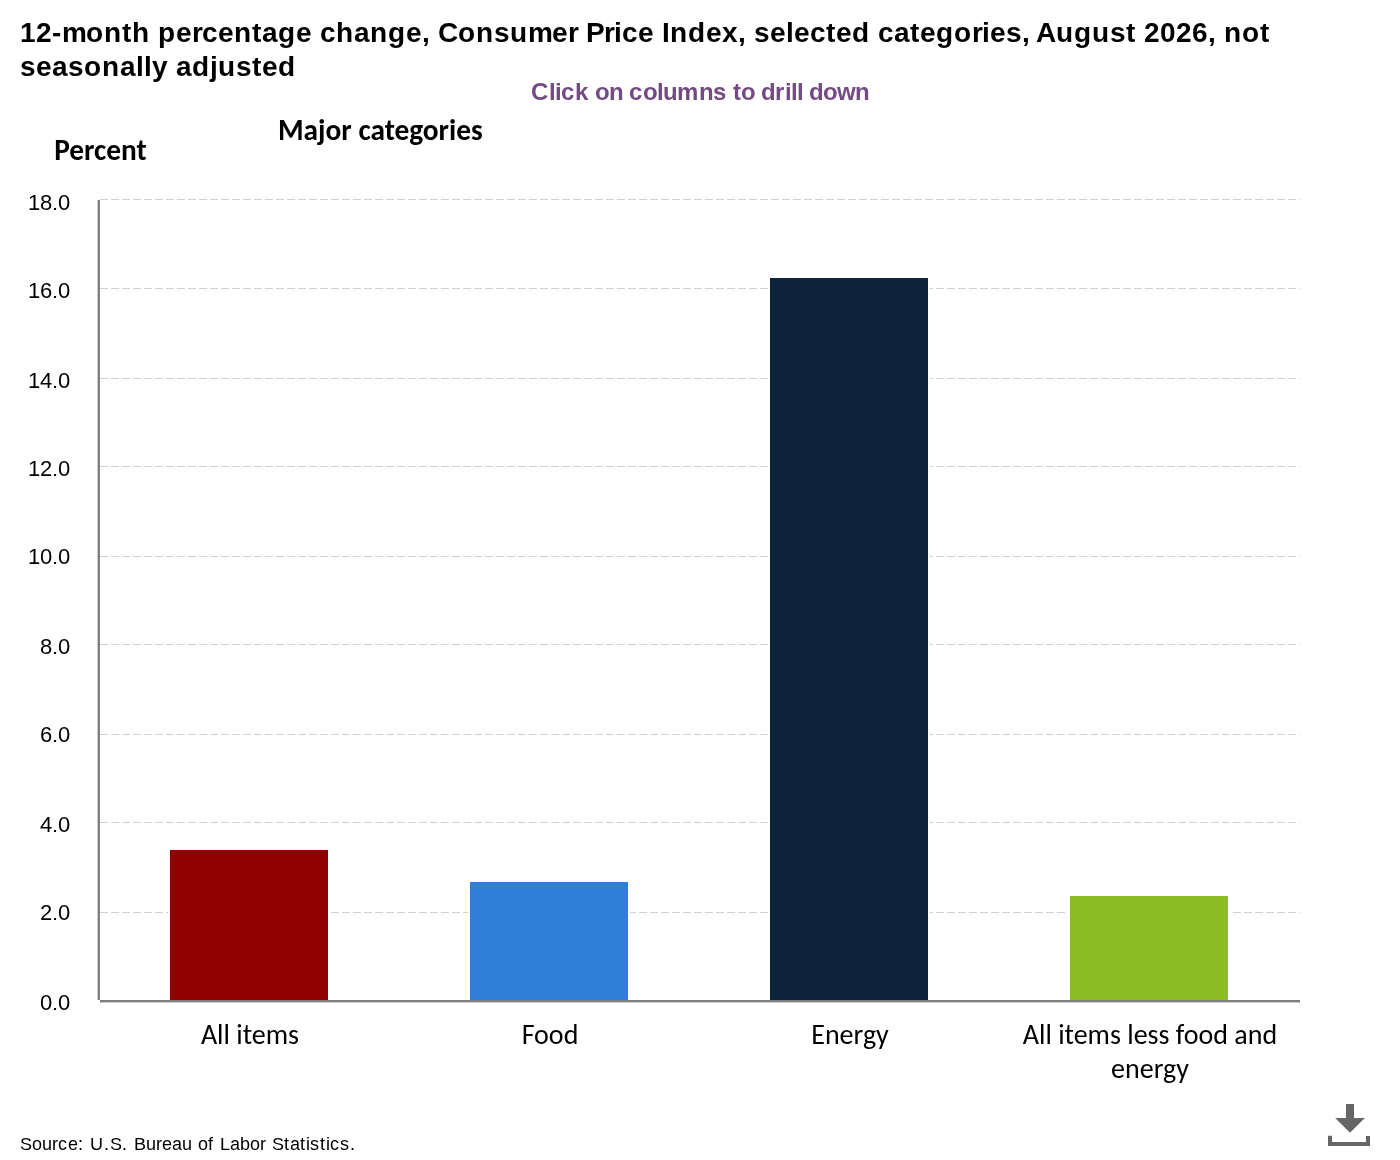
US CPI 12-month % change by category. Source: Bureau of Labor Statistics
Crypto, stocks and gold traditionally benefit from lower-than-expected inflation readings as these reduce the odds of the Fed tightening policy, allowing for capital inflows to strengthen. Speaking to Reuters about current gold prices and US bond yields, Tim Waterer, chief market analyst at KCM Trade, drew attention to the impact of a surprise move to the downside for CPI and PPI readings in particular.
“In the short term, a cooler-than-expected US inflation reading would be the clearest near-term catalyst, as it would reduce the odds of further Fed tightening and ease pressure on real yield,” he said.
CME FedWatch shows that markets see just an 18.8% chance of a rate hike on Oct. 28 from the current 3.75-4.00% range. The following meeting, in December, is attracting 70.6% odds of the Fed hiking by 25 basis points to 4.00-4.25%.
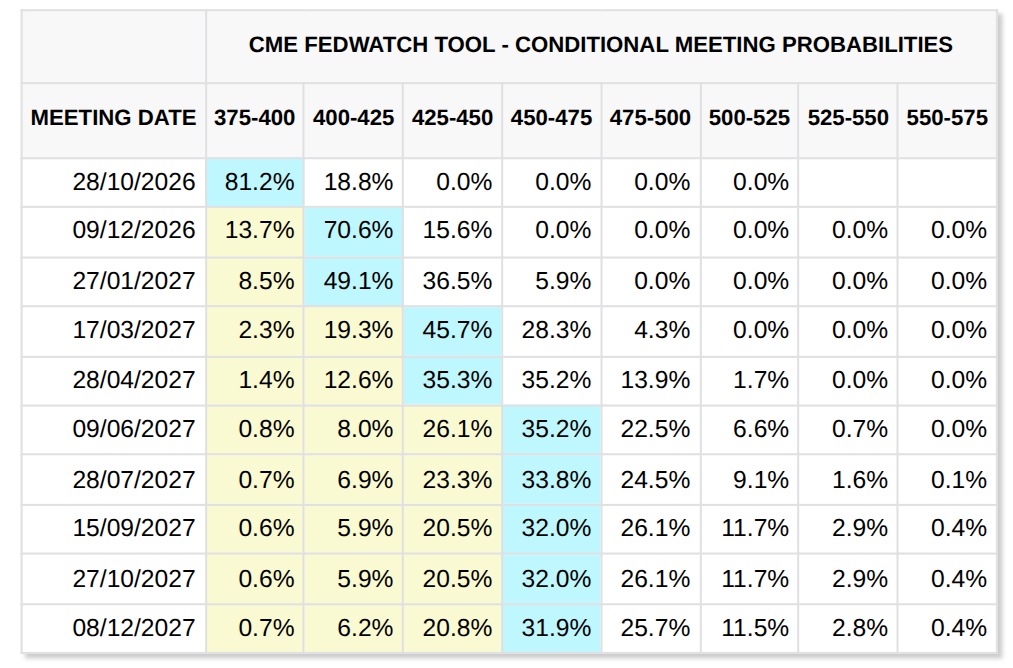
Fed target-rate probabilities (screenshot). Source: CME Group
Fed chair Kevin Warsh is due to hold a discussion with Kristalina Georgieva, managing director of the International Monetary Fund (IMF), at an event in Bangkok, Thailand on Friday.
Oil briefly cools on US-Russia diesel announcement
US bond yields have come off 24-year highs seen last week, with the 10-year and 30-year yields at 5.24% and 5.60%, respectively, on Monday.
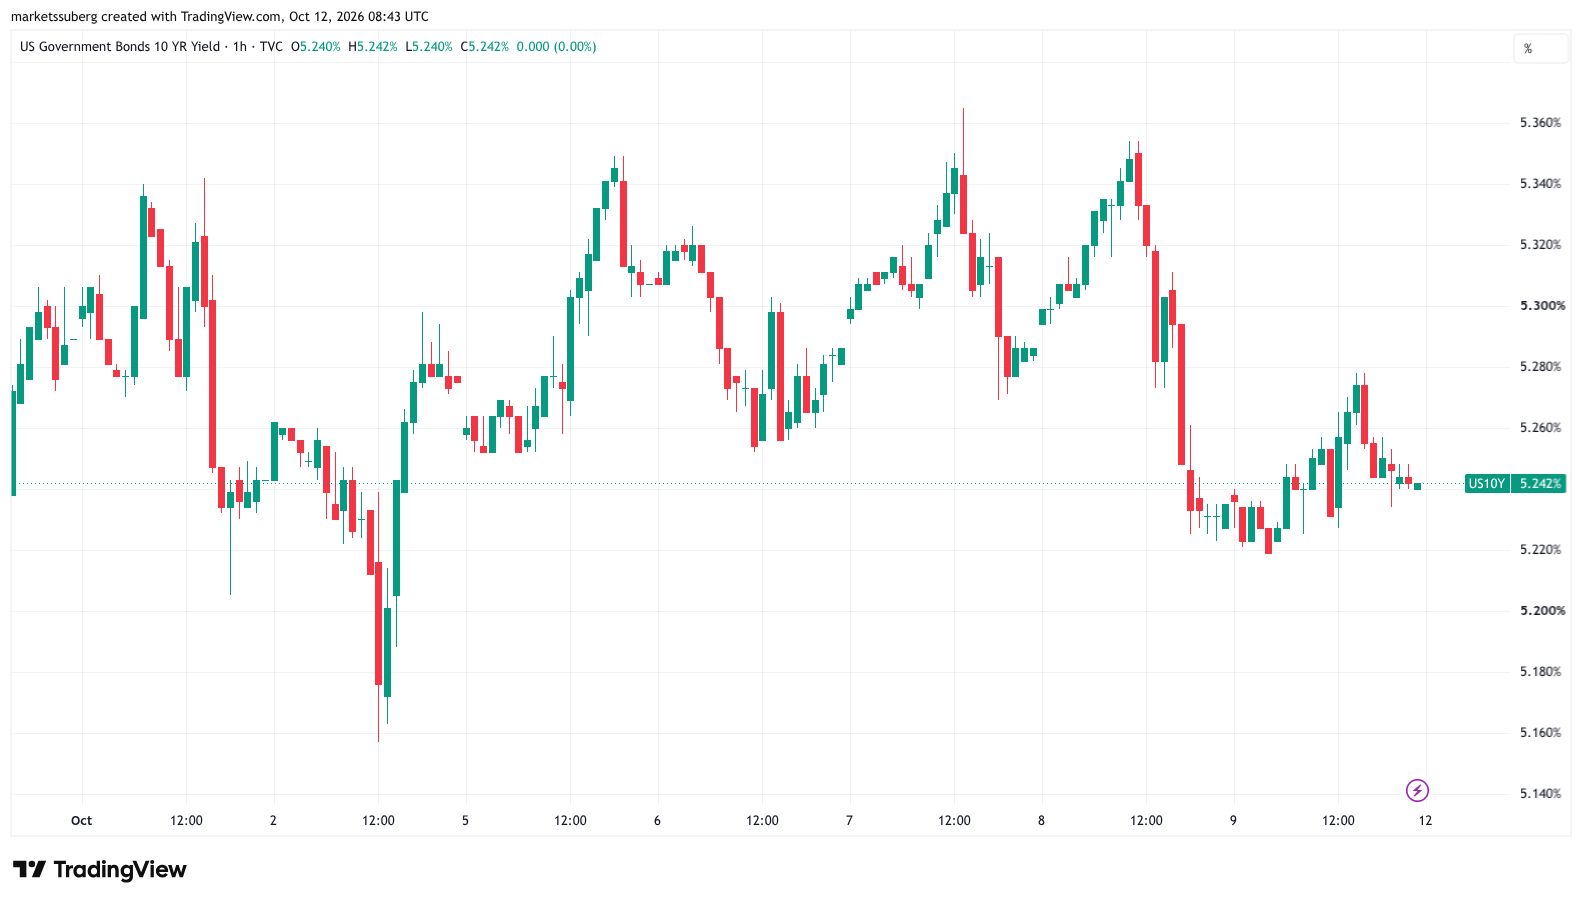
US 10-year bond yield one-hour chart. Source: Cointelegraph/TradingView
Stocks futures were green to start the week, with the S&P 500 index up 0.25% and around 30 points off new all-time highs.
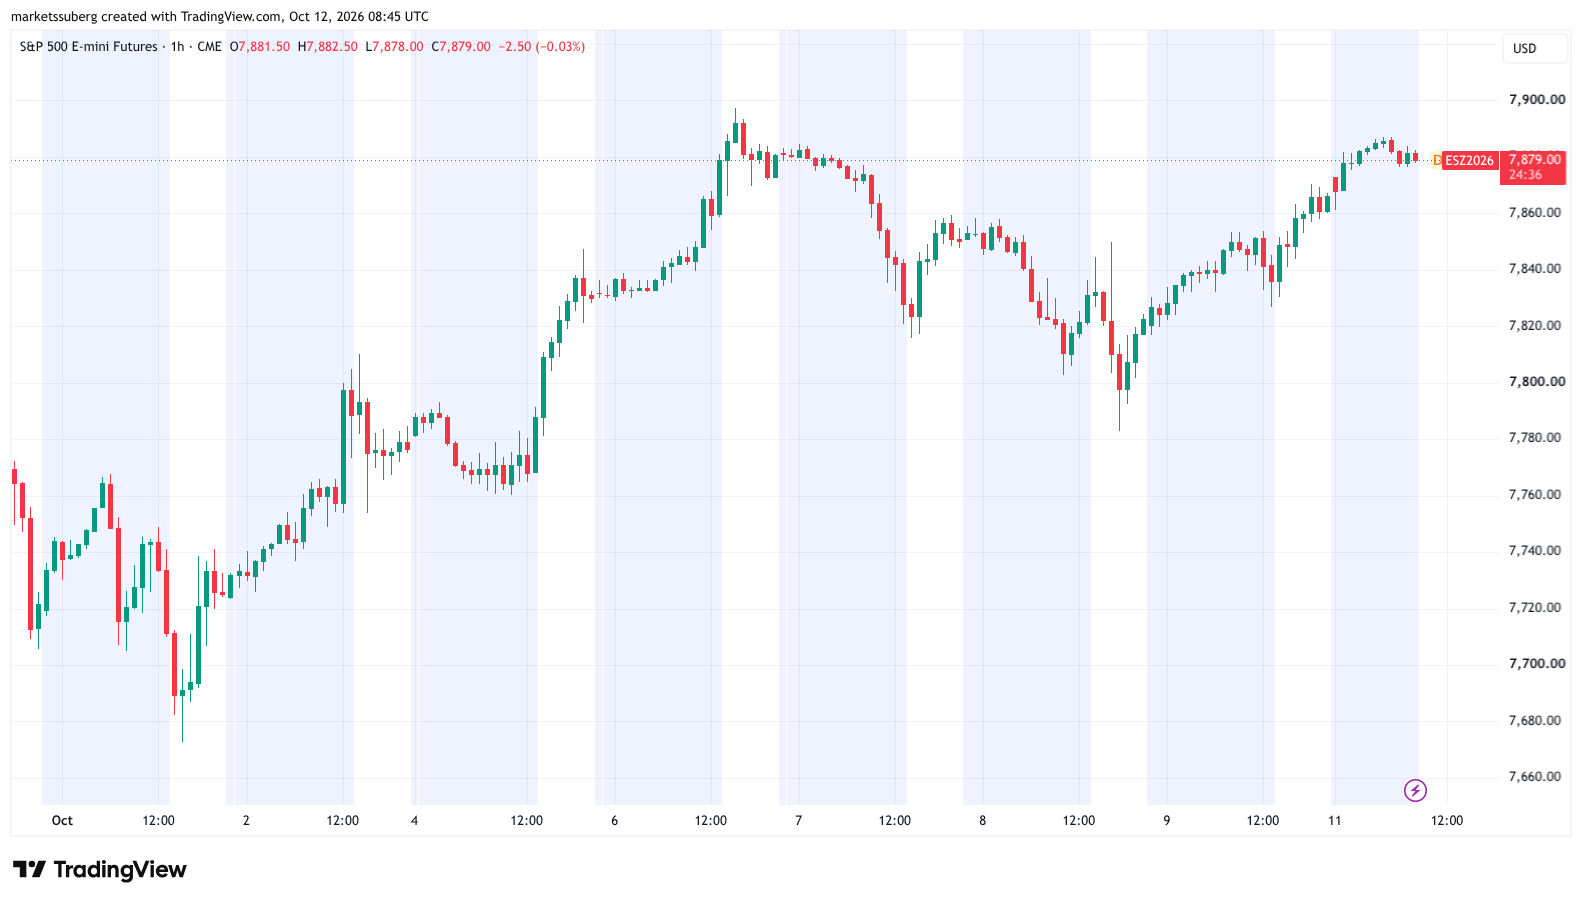
S&P 500 futures one-hour chart. Source: Cointelegraph/TradingView
An announcement by US President Donald Trump over a deal to buy 300,000 tons of diesel from Russia appeared to have only a modest knock-on effect on oil prices, with the plan facing growing bipartisan backlash. Trump also announced an “energy ceasefire” between Russia and Ukraine.
“Effective immediately, there is an ENERGY CEASEFIRE in the War between Russia and Ukraine. Both parties have agreed,” he wrote on Sunday in a post on Truth Social. Ukraine’s President Volodymyr Zelenskyy said he was unaware of the energy ceasefire.
WTI crude traded around $91.50 per barrel on Monday, up 2% from the day’s low of $89.60. Data from motorist group AAA put the average price of diesel at $6.26 per gallon versus all-time highs of $6.52 seen on Sept. 22.
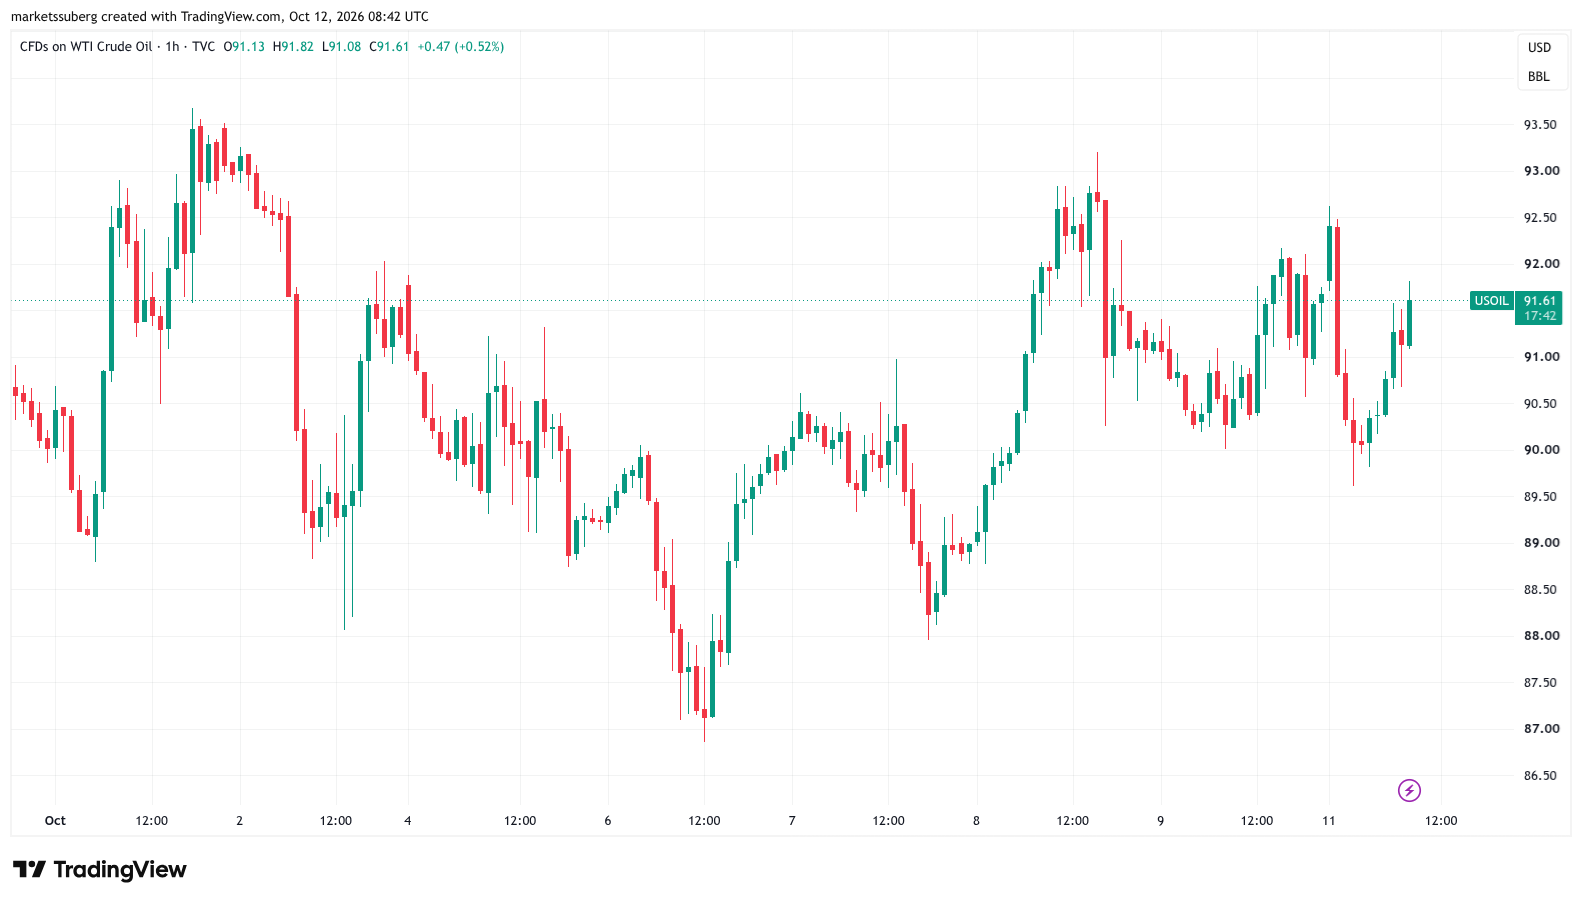
CFDs on WTI crude oil one-hour chart. Source: Cointelegraph/TradingView
PVM analyst Tamas Varga told Reuters Russia’s reduced output capacity made the impact of the deal “questionable.”
“However, Moscow has partially lifted its ban on diesel exports, allowing 500,000 tonnes (around 3.7 million barrels) to be released onto the international market, equivalent to roughly one day of US consumption and around 13% of global demand,” he noted.
Bitcoin avoids support breakdown at weekly close
At around $83,700 on Bitstamp, Sunday’s weekly candle close cemented a 3.2% weekly decline for BTC/USD.
Related: Here’s what happened in crypto today
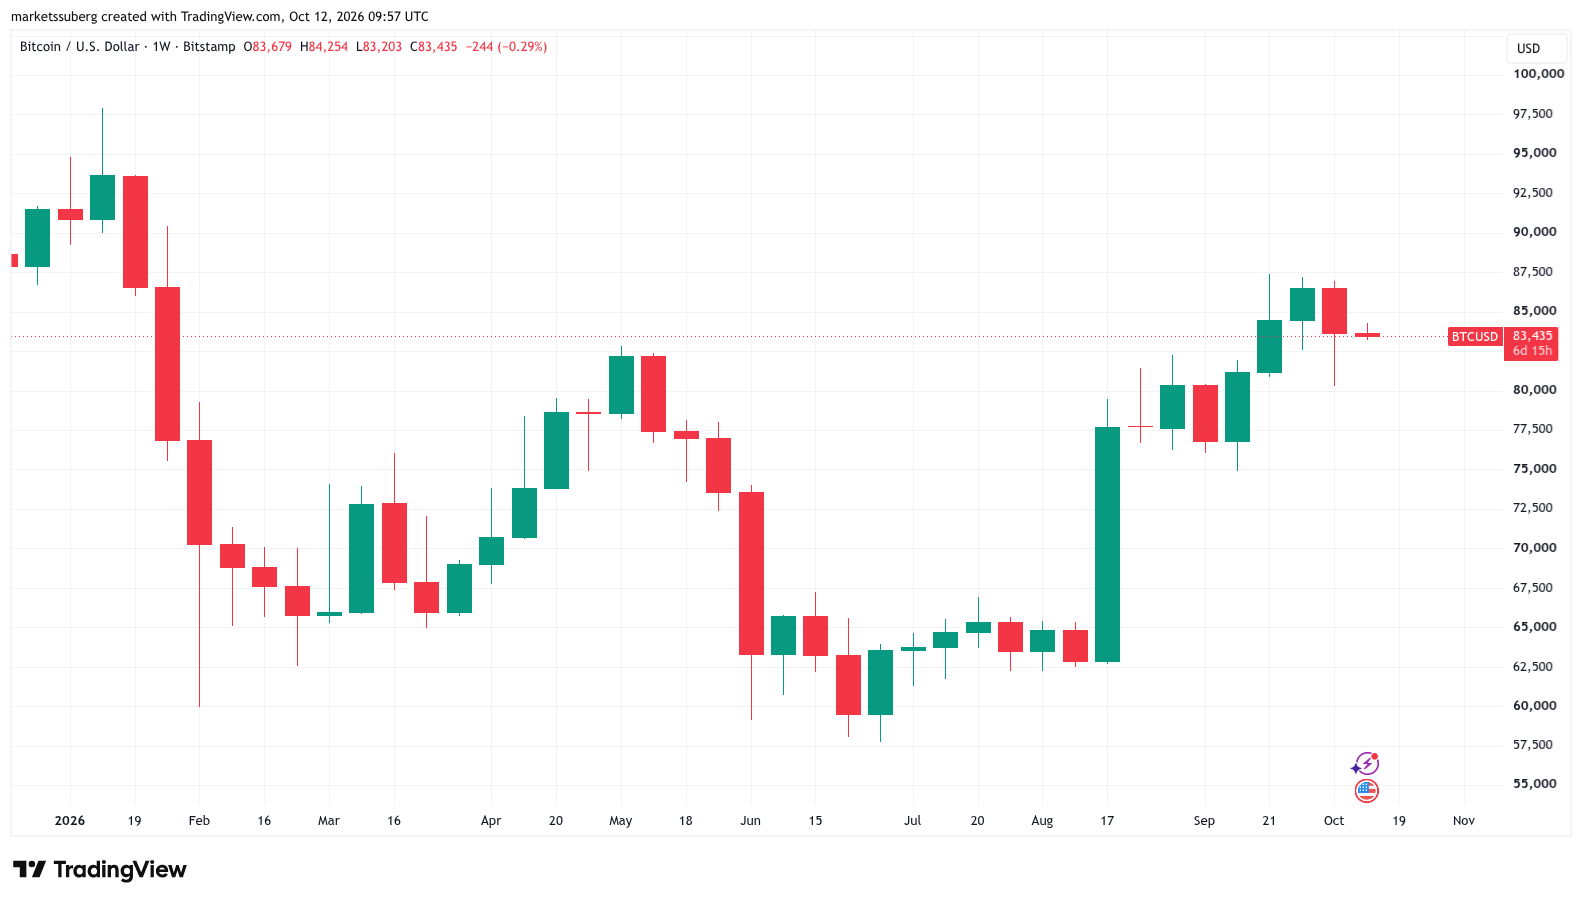
BTC/USD one-week chart. Source: Cointelegraph/TradingView
At the same time, the pair preserved a key support level at $82,500 on weekly time frames, thus avoiding a return to its previous long-term range between $60,000 and $80,000. As Cointelegraph reported, $82,500 remains on traders’ radar as a crucial line in the sand for Bitcoin bulls.
Last week, trader and analyst Rekt Capital wrote that a weekly close above $82,500 would mark a “successful” support retest. This in turn could see investors continue to reaccumulate BTC at current levels, opening up the path higher in a manner similar to Bitcoin’s recovery from its 2022 bear market.
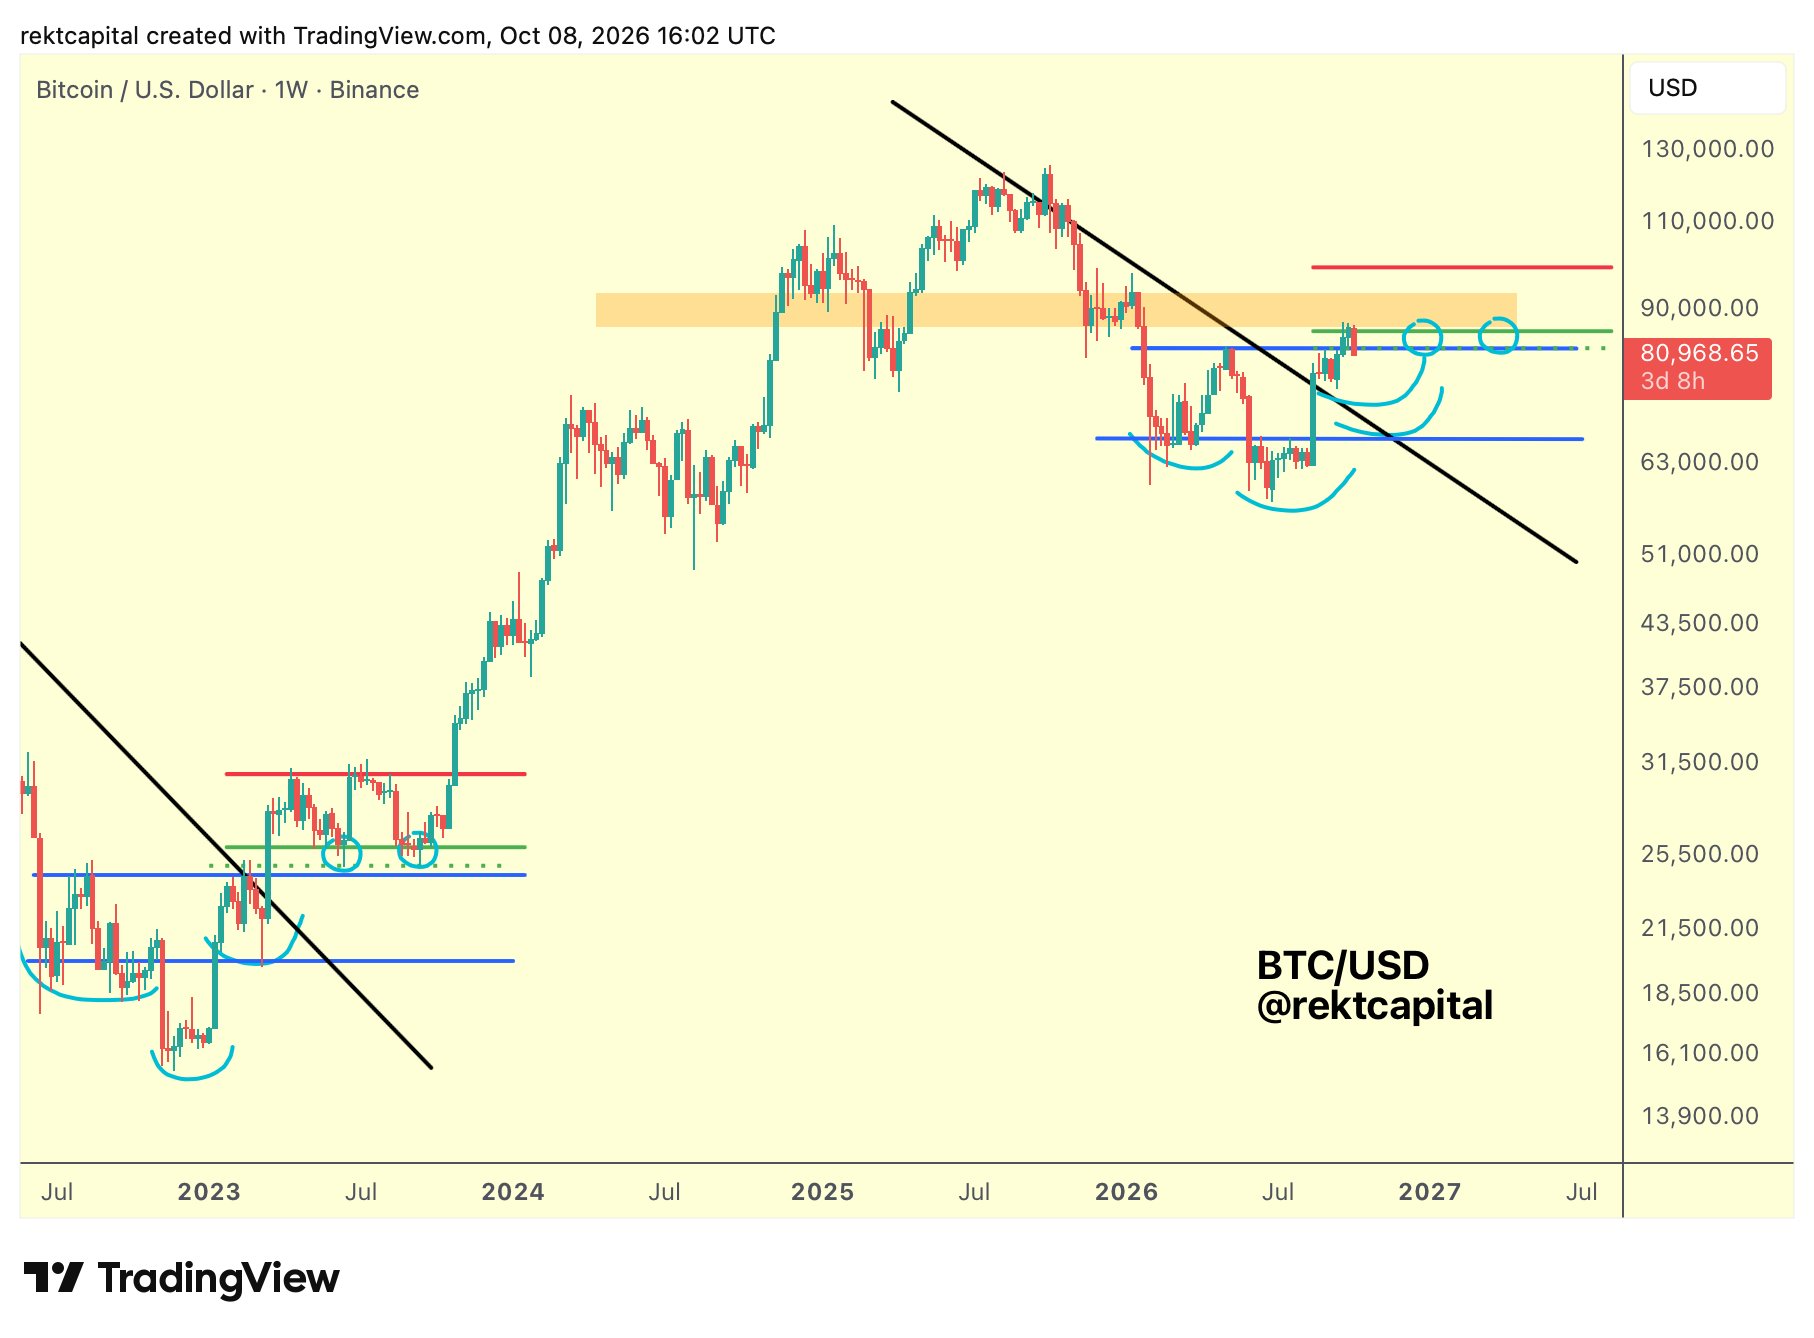
BTC/USD one-week chart. Source: Rekt Capital on X.com
In light of Bitcoin’s multiple support retests after its initial breakout in July, trader and analyst Aksel Kibar drew comparisons between crypto and stock markets. Since May, the S&P 500 has seen multiple retests at key levels, initially at 7,300 points and then at 7,600 points.
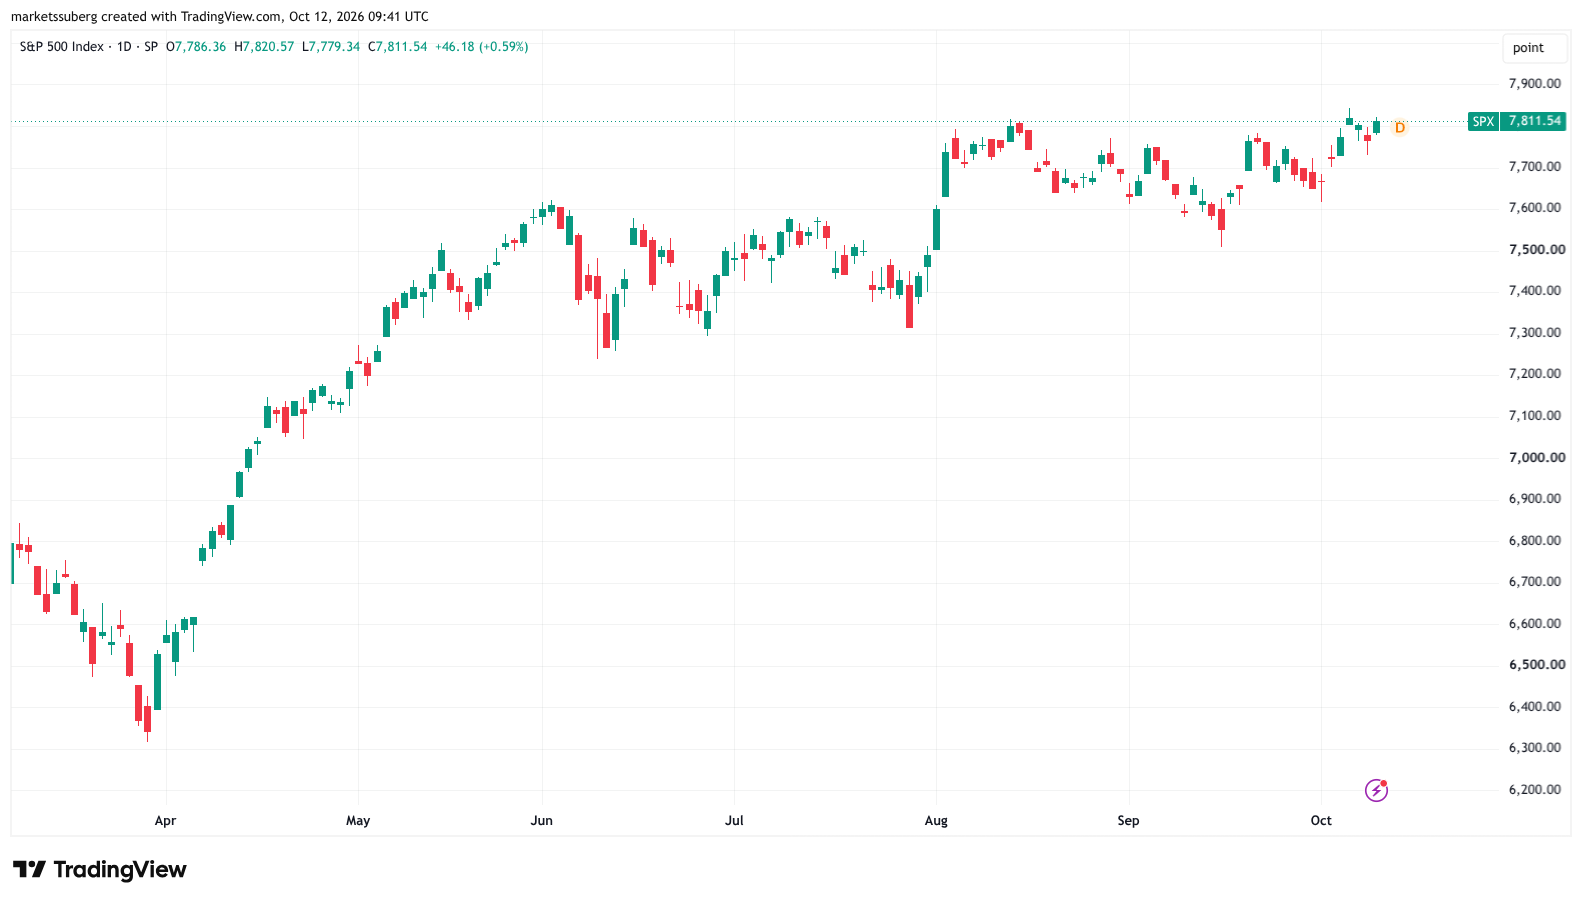
S&P 500 one-day chart. Source: Cointelegraph/TradingView
Bitcoin could be experiencing a “hard retest” of support in a similar manner, with the implication that BTC/USD should shift higher if those retests continued to be successful, Kibar wrote in an X post on Sunday.
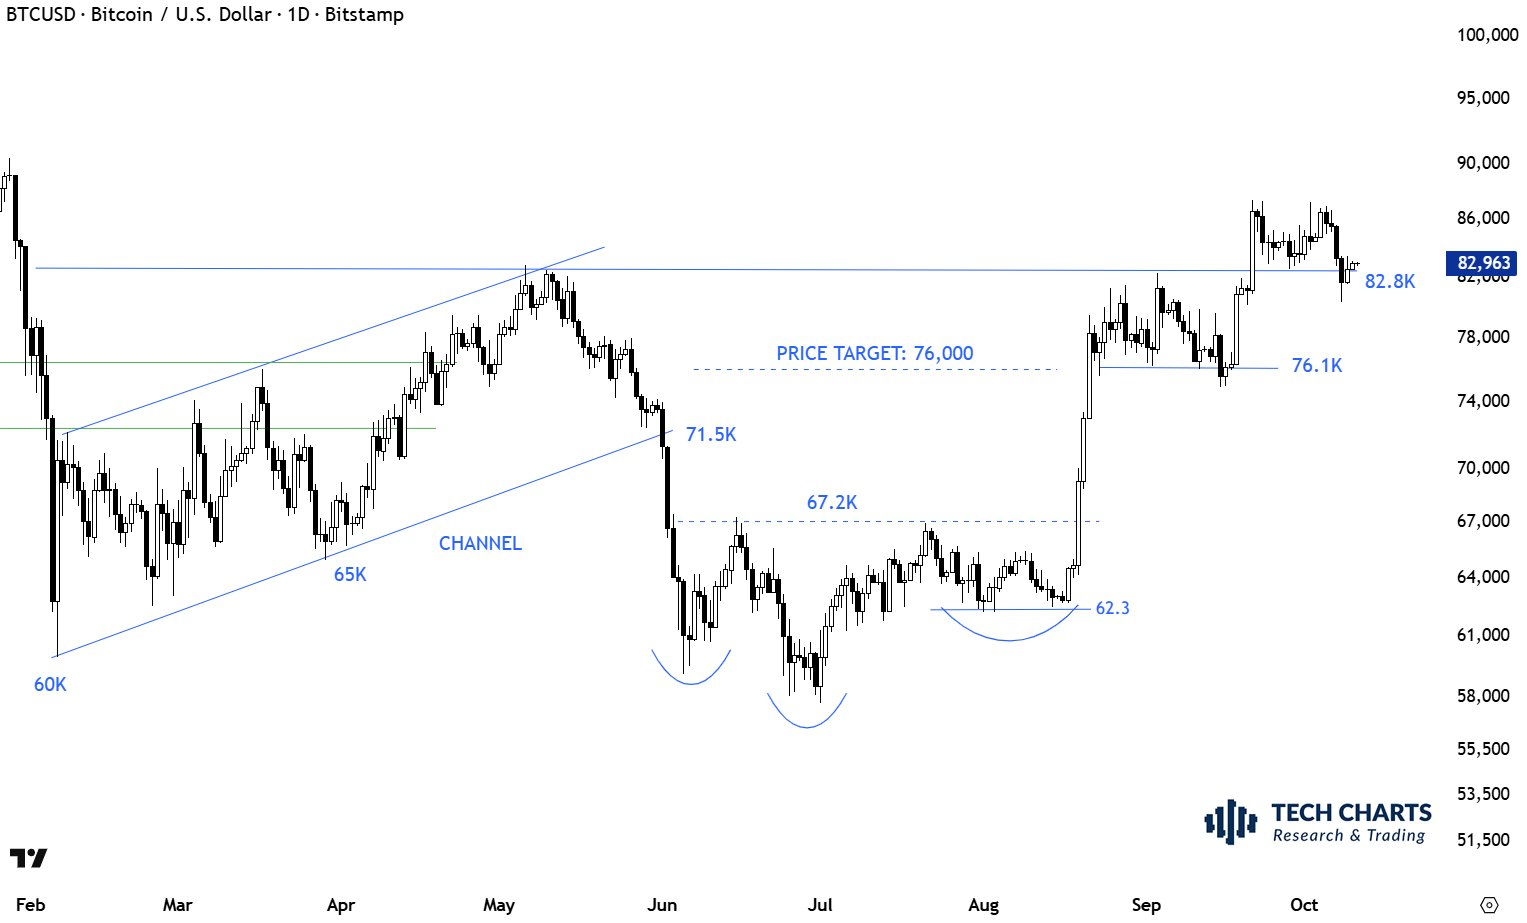
BTC/USD one-day chart. Source: Aksel Kibar on X.com
This article is produced in accordance with Cointelegraph's Editorial Policy and is intended for informational purposes only. It does not constitute investment advice or recommendations. All investments and trades carry risk; readers are encouraged to conduct independent research.